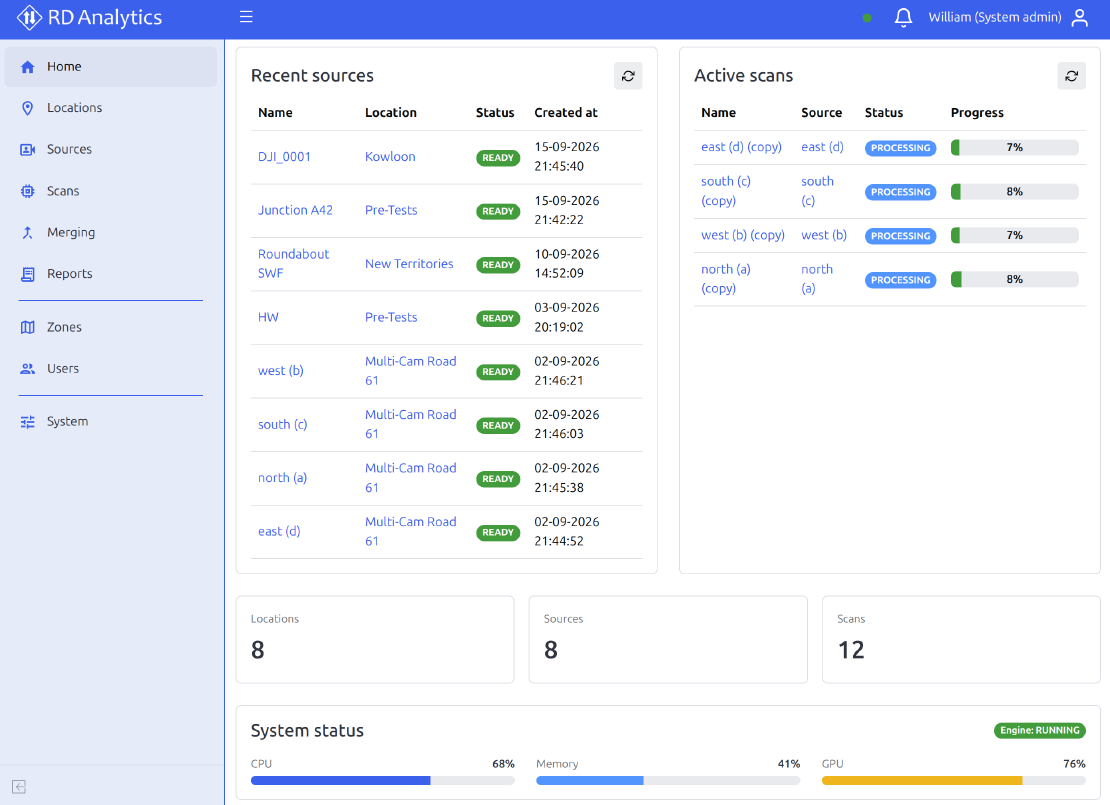









First time with RD Analytics?
This page focuses on the latest features in version 5. If you are still getting to know RD Analytics, start with the core product overview, then come back for the v5 details.
Core capabilitiesProject organization and performance
Zones and locations
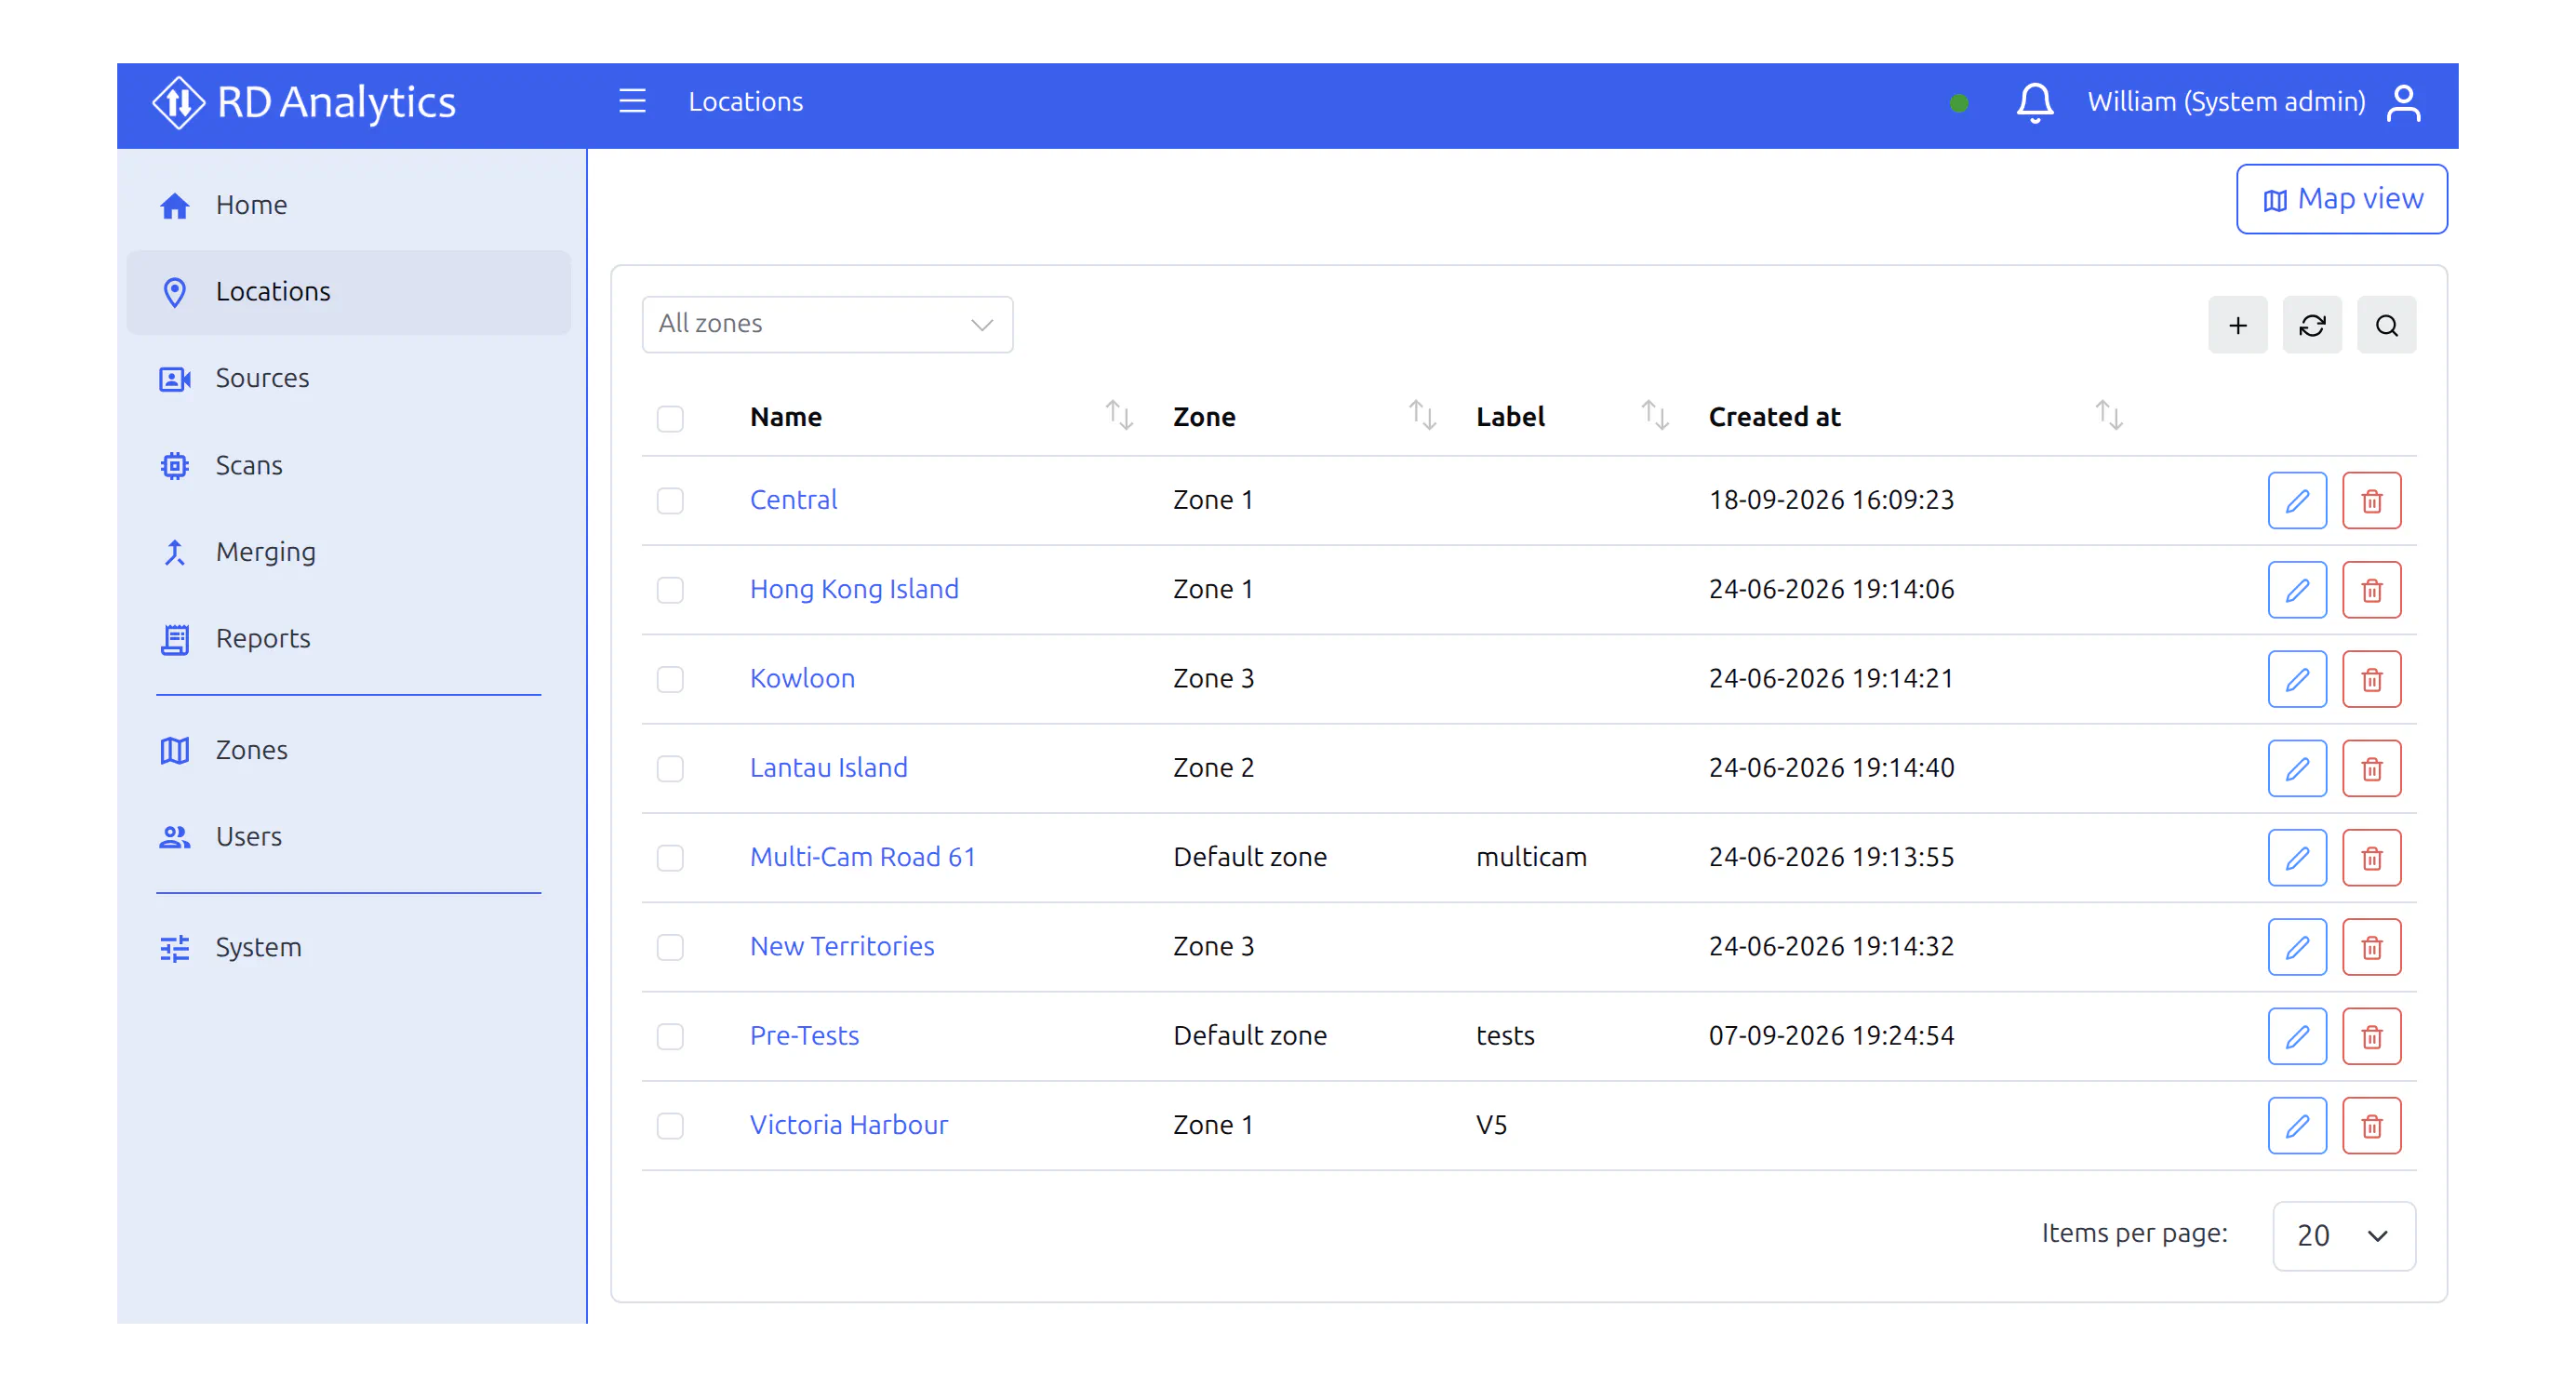
Assign each person to specific zones — they only see the projects and sites in those zones, not other clients or regions. Inside each zone you can add any number of locations (junctions, corridors, survey sites), so several projects can share one system without mixing data, and the next study is easier to find by place.
This is the backbone of how v5 organises work: zone → location → video sources → analysis → reports. A city-wide study, a private client, and an inter-urban corridor can sit on the same server, yet stay cleanly separated for the people who use them. When someone leaves a project or a new subcontractor joins, you change their zone access — you do not rebuild the whole workspace.
This is the backbone of how v5 organises work: zone → location → video sources → analysis → reports. A city-wide study, a private client, and an inter-urban corridor can sit on the same server, yet stay cleanly separated for the people who use them. When someone leaves a project or a new subcontractor joins, you change their zone access — you do not rebuild the whole workspace.
Locations on a map
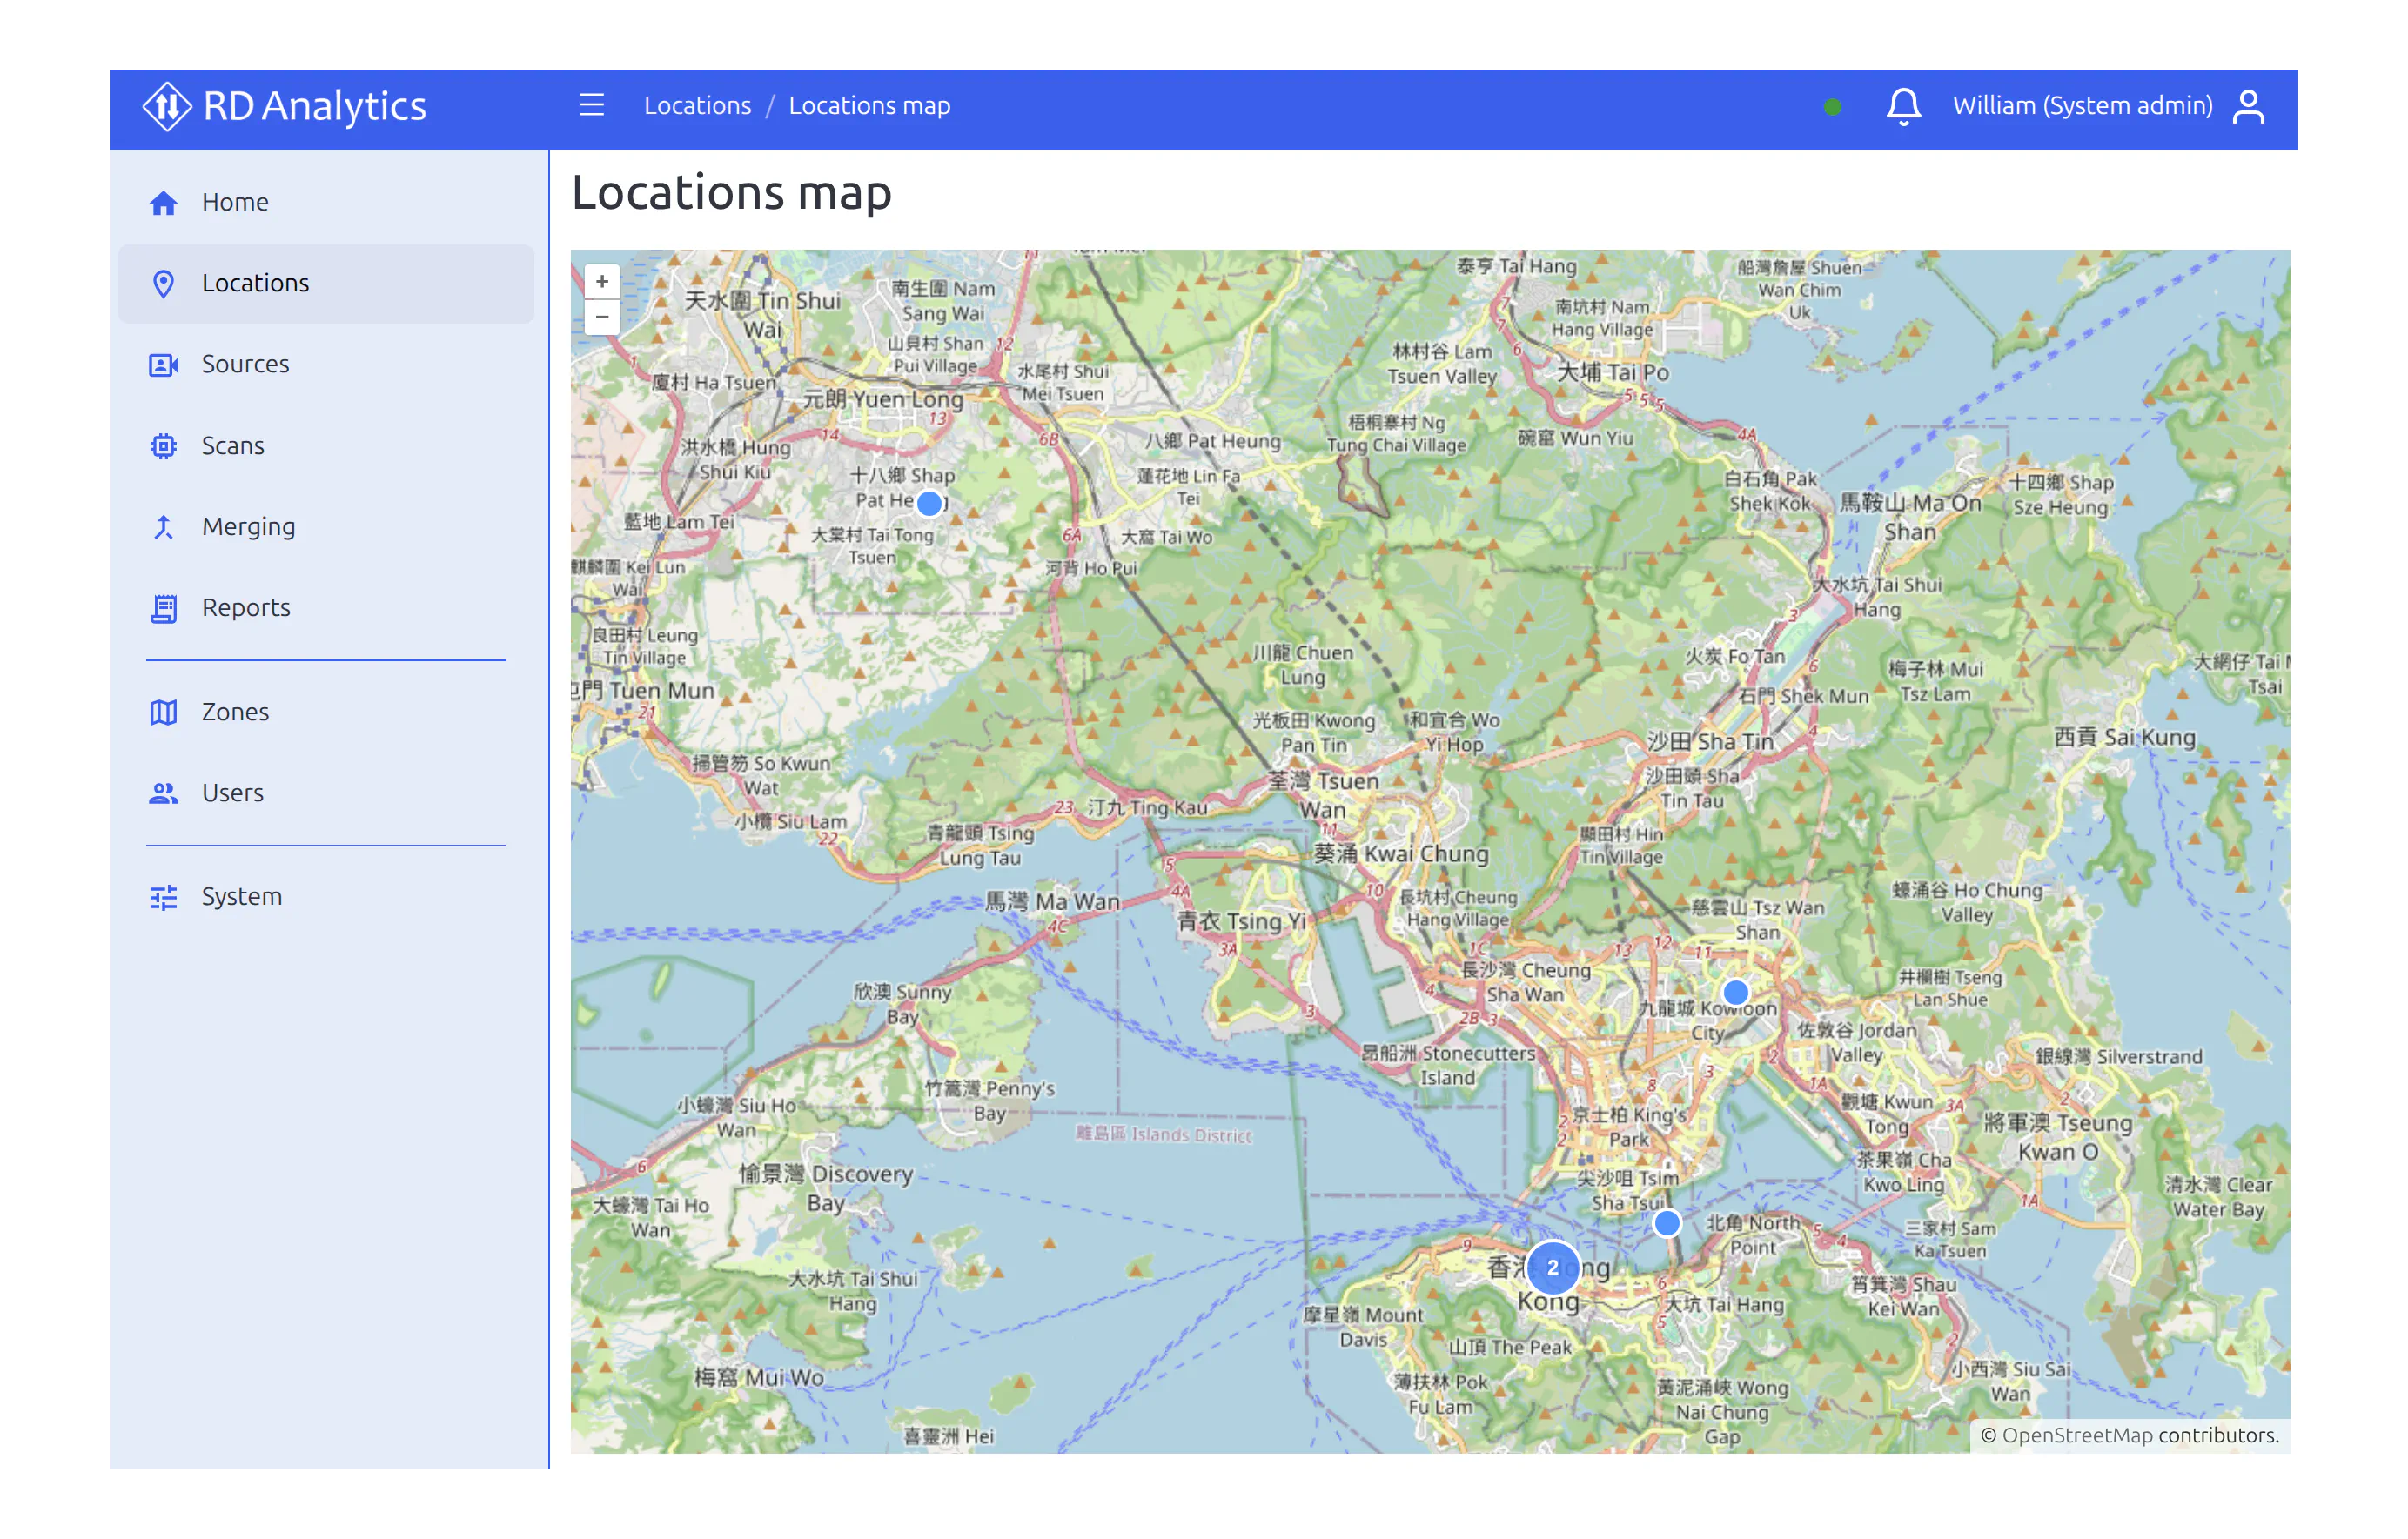
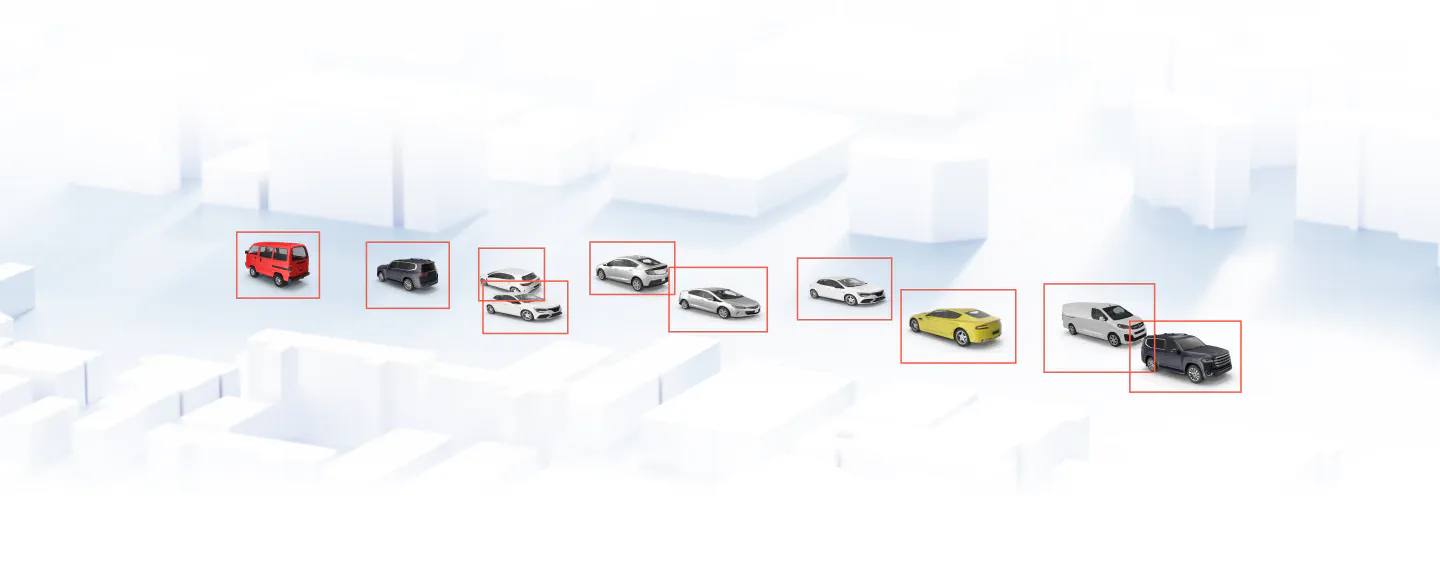
Put locations on an interactive map and open a site from its marker. Geographic context sits next to the work, which helps managers and field teams share the same picture of where studies run.
Instead of hunting through long name lists, you zoom to a district, spot the junction, and jump straight into its cameras or video files. That is useful in kick-off meetings, when briefing field staff, or when a client asks “which sites did you cover last quarter?” — the map answers faster than a spreadsheet of codes.
Instead of hunting through long name lists, you zoom to a district, spot the junction, and jump straight into its cameras or video files. That is useful in kick-off meetings, when briefing field staff, or when a client asks “which sites did you cover last quarter?” — the map answers faster than a spreadsheet of codes.
Three user levels
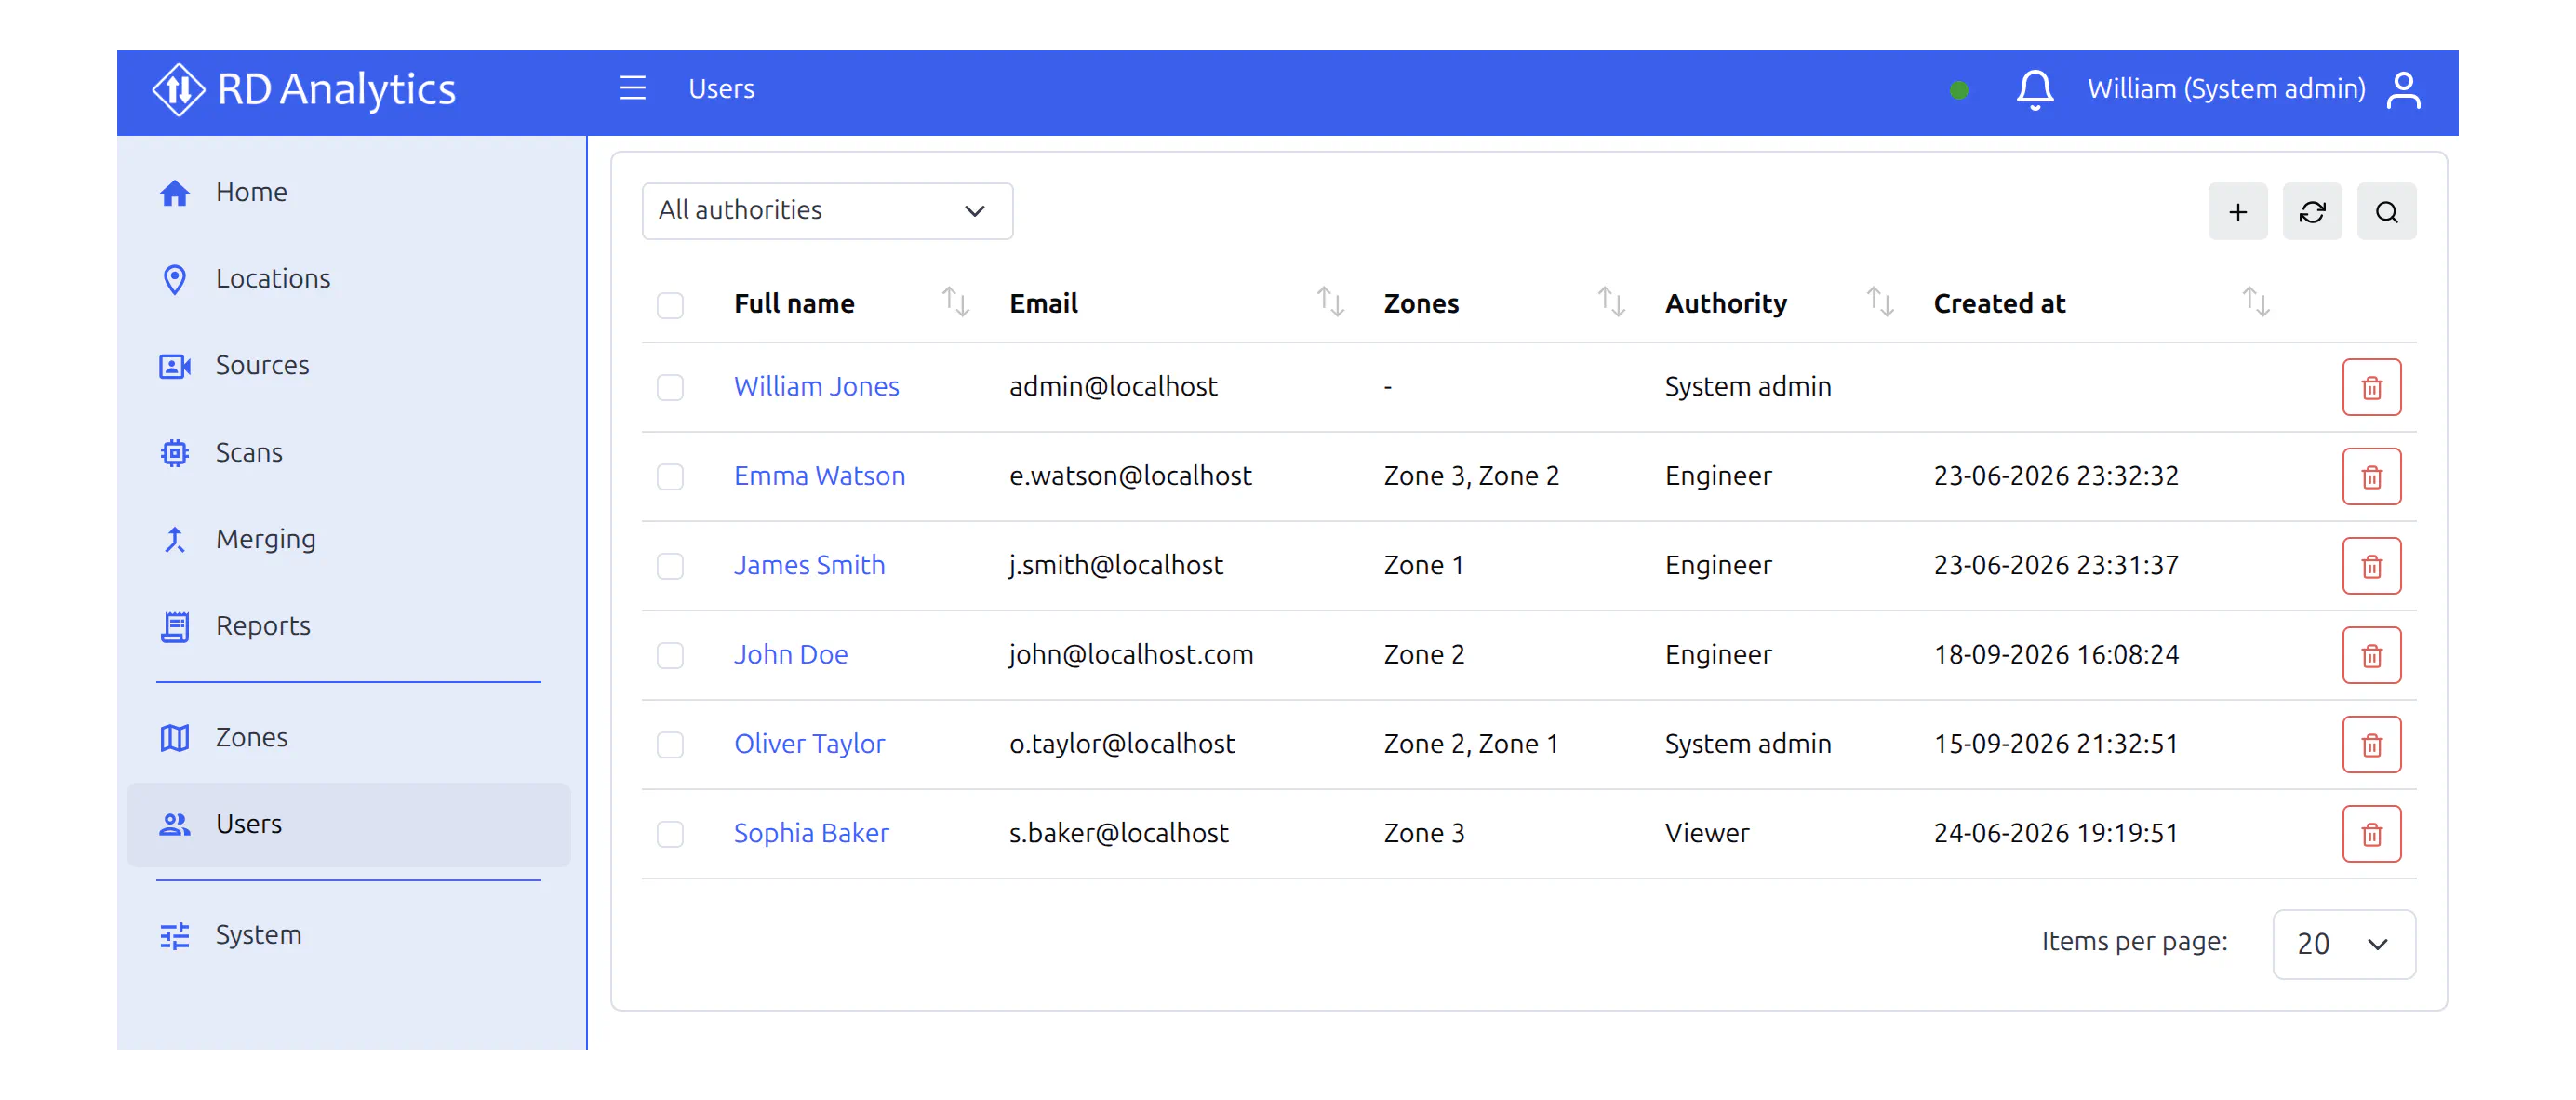
System admin, Engineer, and Viewer match how survey teams actually work. Leads set up the system, analysts run the studies, and stakeholders can open results without changing anything. That means less risk of accidental edits — and clearer ownership of who does what.
In practice: admins handle licences, models, users, and zones; engineers create locations, upload video, configure counting, and run processing; viewers open the same operational screens in read-only mode — ideal for clients, auditors, or managers who only need the numbers. Compared with a simple “admin vs everyone else” split, this reduces training overhead and keeps sensitive setup out of day-to-day hands.
In practice: admins handle licences, models, users, and zones; engineers create locations, upload video, configure counting, and run processing; viewers open the same operational screens in read-only mode — ideal for clients, auditors, or managers who only need the numbers. Compared with a simple “admin vs everyone else” split, this reduces training overhead and keeps sensitive setup out of day-to-day hands.
Windows 11 support
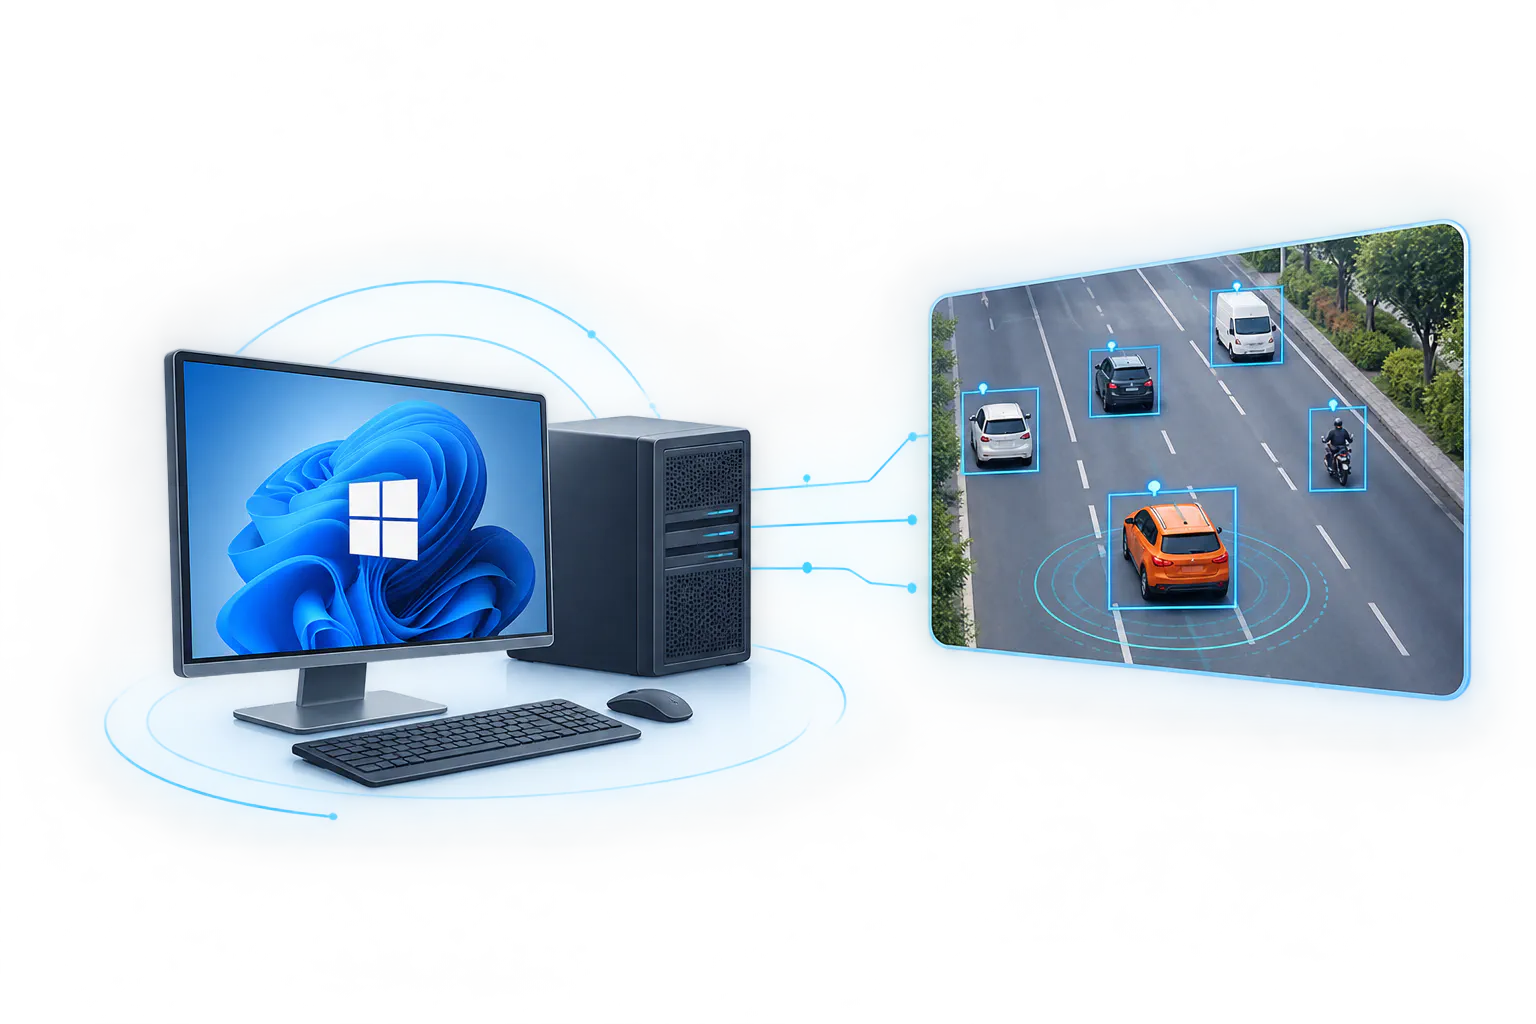
Linux is still recommended, but Windows 11 is now a valid option. Offices that standardise on Windows PCs can host RD Analytics 5 without forcing a separate Linux-only workstation for every deployment.
For many consultancies and municipal IT teams, that removes a procurement blocker: the analysis box can follow the same desktop standard as the rest of the office. Linux remains the preferred path for dedicated servers and long-running production hosts; Windows 11 covers sites where a Windows machine is simply what you already have on the desk or in the rack.
For many consultancies and municipal IT teams, that removes a procurement blocker: the analysis box can follow the same desktop standard as the rest of the office. Linux remains the preferred path for dedicated servers and long-running production hosts; Windows 11 covers sites where a Windows machine is simply what you already have on the desk or in the rack.
Better parallel processing
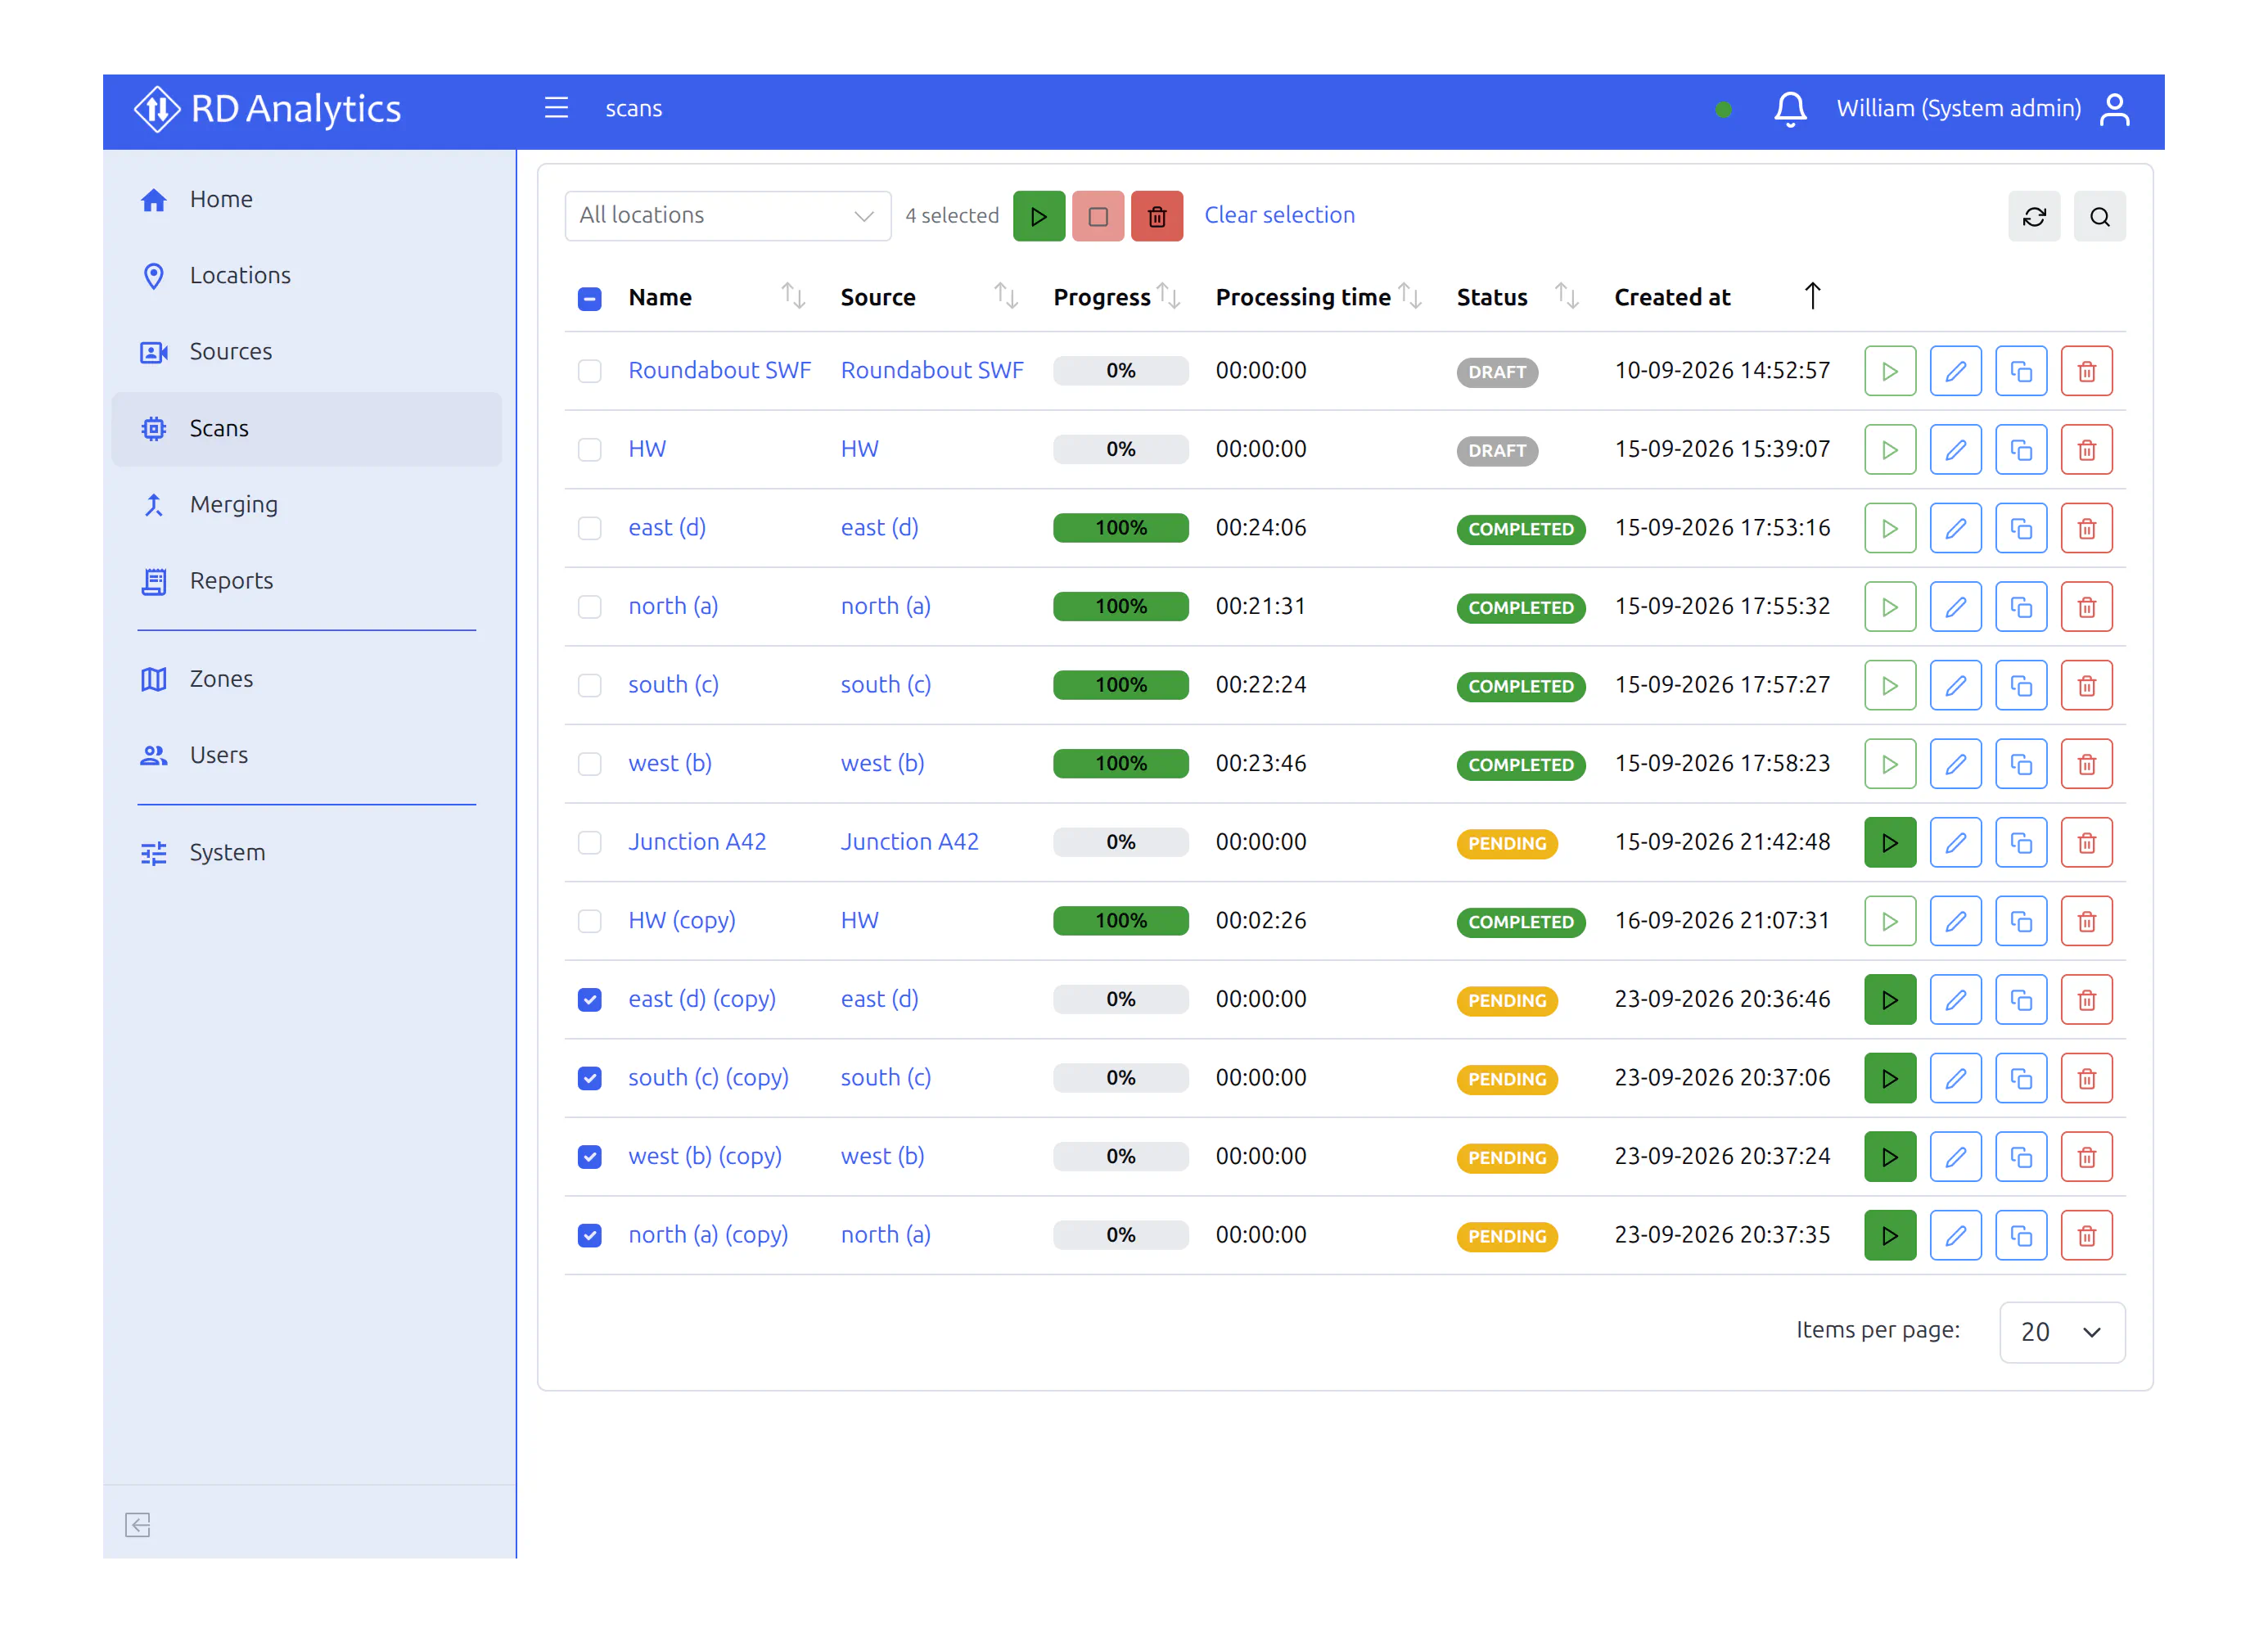
Run more video analyses at the same time on one machine. Heavier survey weeks finish sooner because the system can work through several files in parallel instead of waiting in a single long queue.
When a corridor study lands as a stack of hourly clips — or several junctions must be processed before a deadline — parallel work is what keeps the schedule honest. Throughput still depends on your licence tier and the graphics hardware in the box, but the platform is built to keep multiple jobs moving instead of serialising everything behind a single queue.
When a corridor study lands as a stack of hourly clips — or several junctions must be processed before a deadline — parallel work is what keeps the schedule honest. Throughput still depends on your licence tier and the graphics hardware in the box, but the platform is built to keep multiple jobs moving instead of serialising everything behind a single queue.
More sensitive vehicle detection
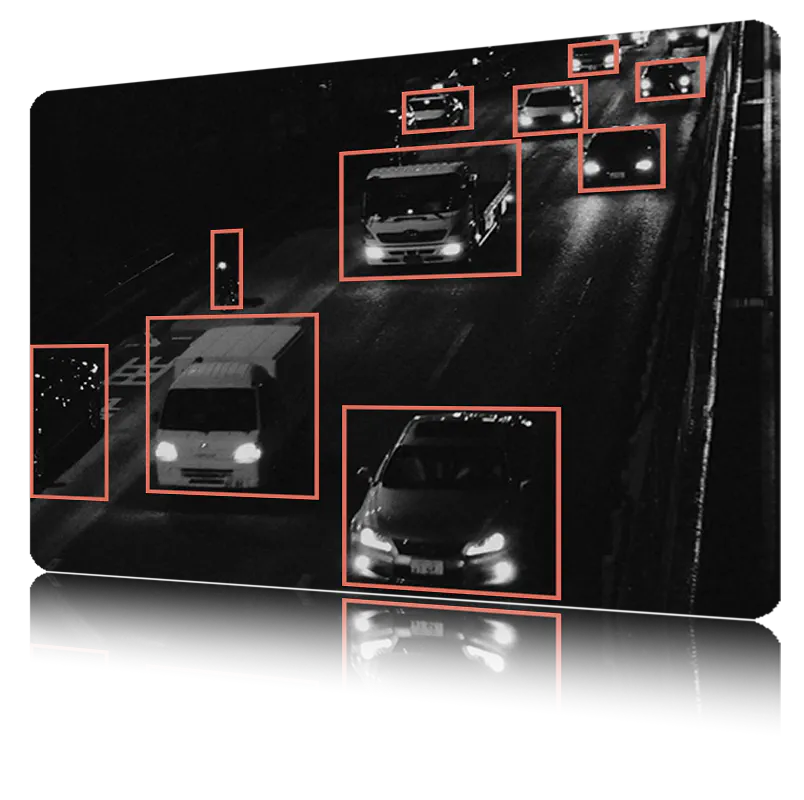
Improved vehicle detector sensitivity means fewer missed vehicles in real road footage. That matters in poor light, busy junctions, and night scenes — where every miss shows up later in the counts.
Better detection feeds everything downstream: cleaner tracks, more reliable line crossings, and reports your team can defend in front of a client. Hard scenes — glare, headlights, partial occlusion — are exactly where “almost good enough” counting loses trust. v5 is tuned for those conditions so you spend less time arguing with the video and more time delivering the study.
Better detection feeds everything downstream: cleaner tracks, more reliable line crossings, and reports your team can defend in front of a client. Hard scenes — glare, headlights, partial occlusion — are exactly where “almost good enough” counting loses trust. v5 is tuned for those conditions so you spend less time arguing with the video and more time delivering the study.
Improved convenience and reports
Add and download files in the browser
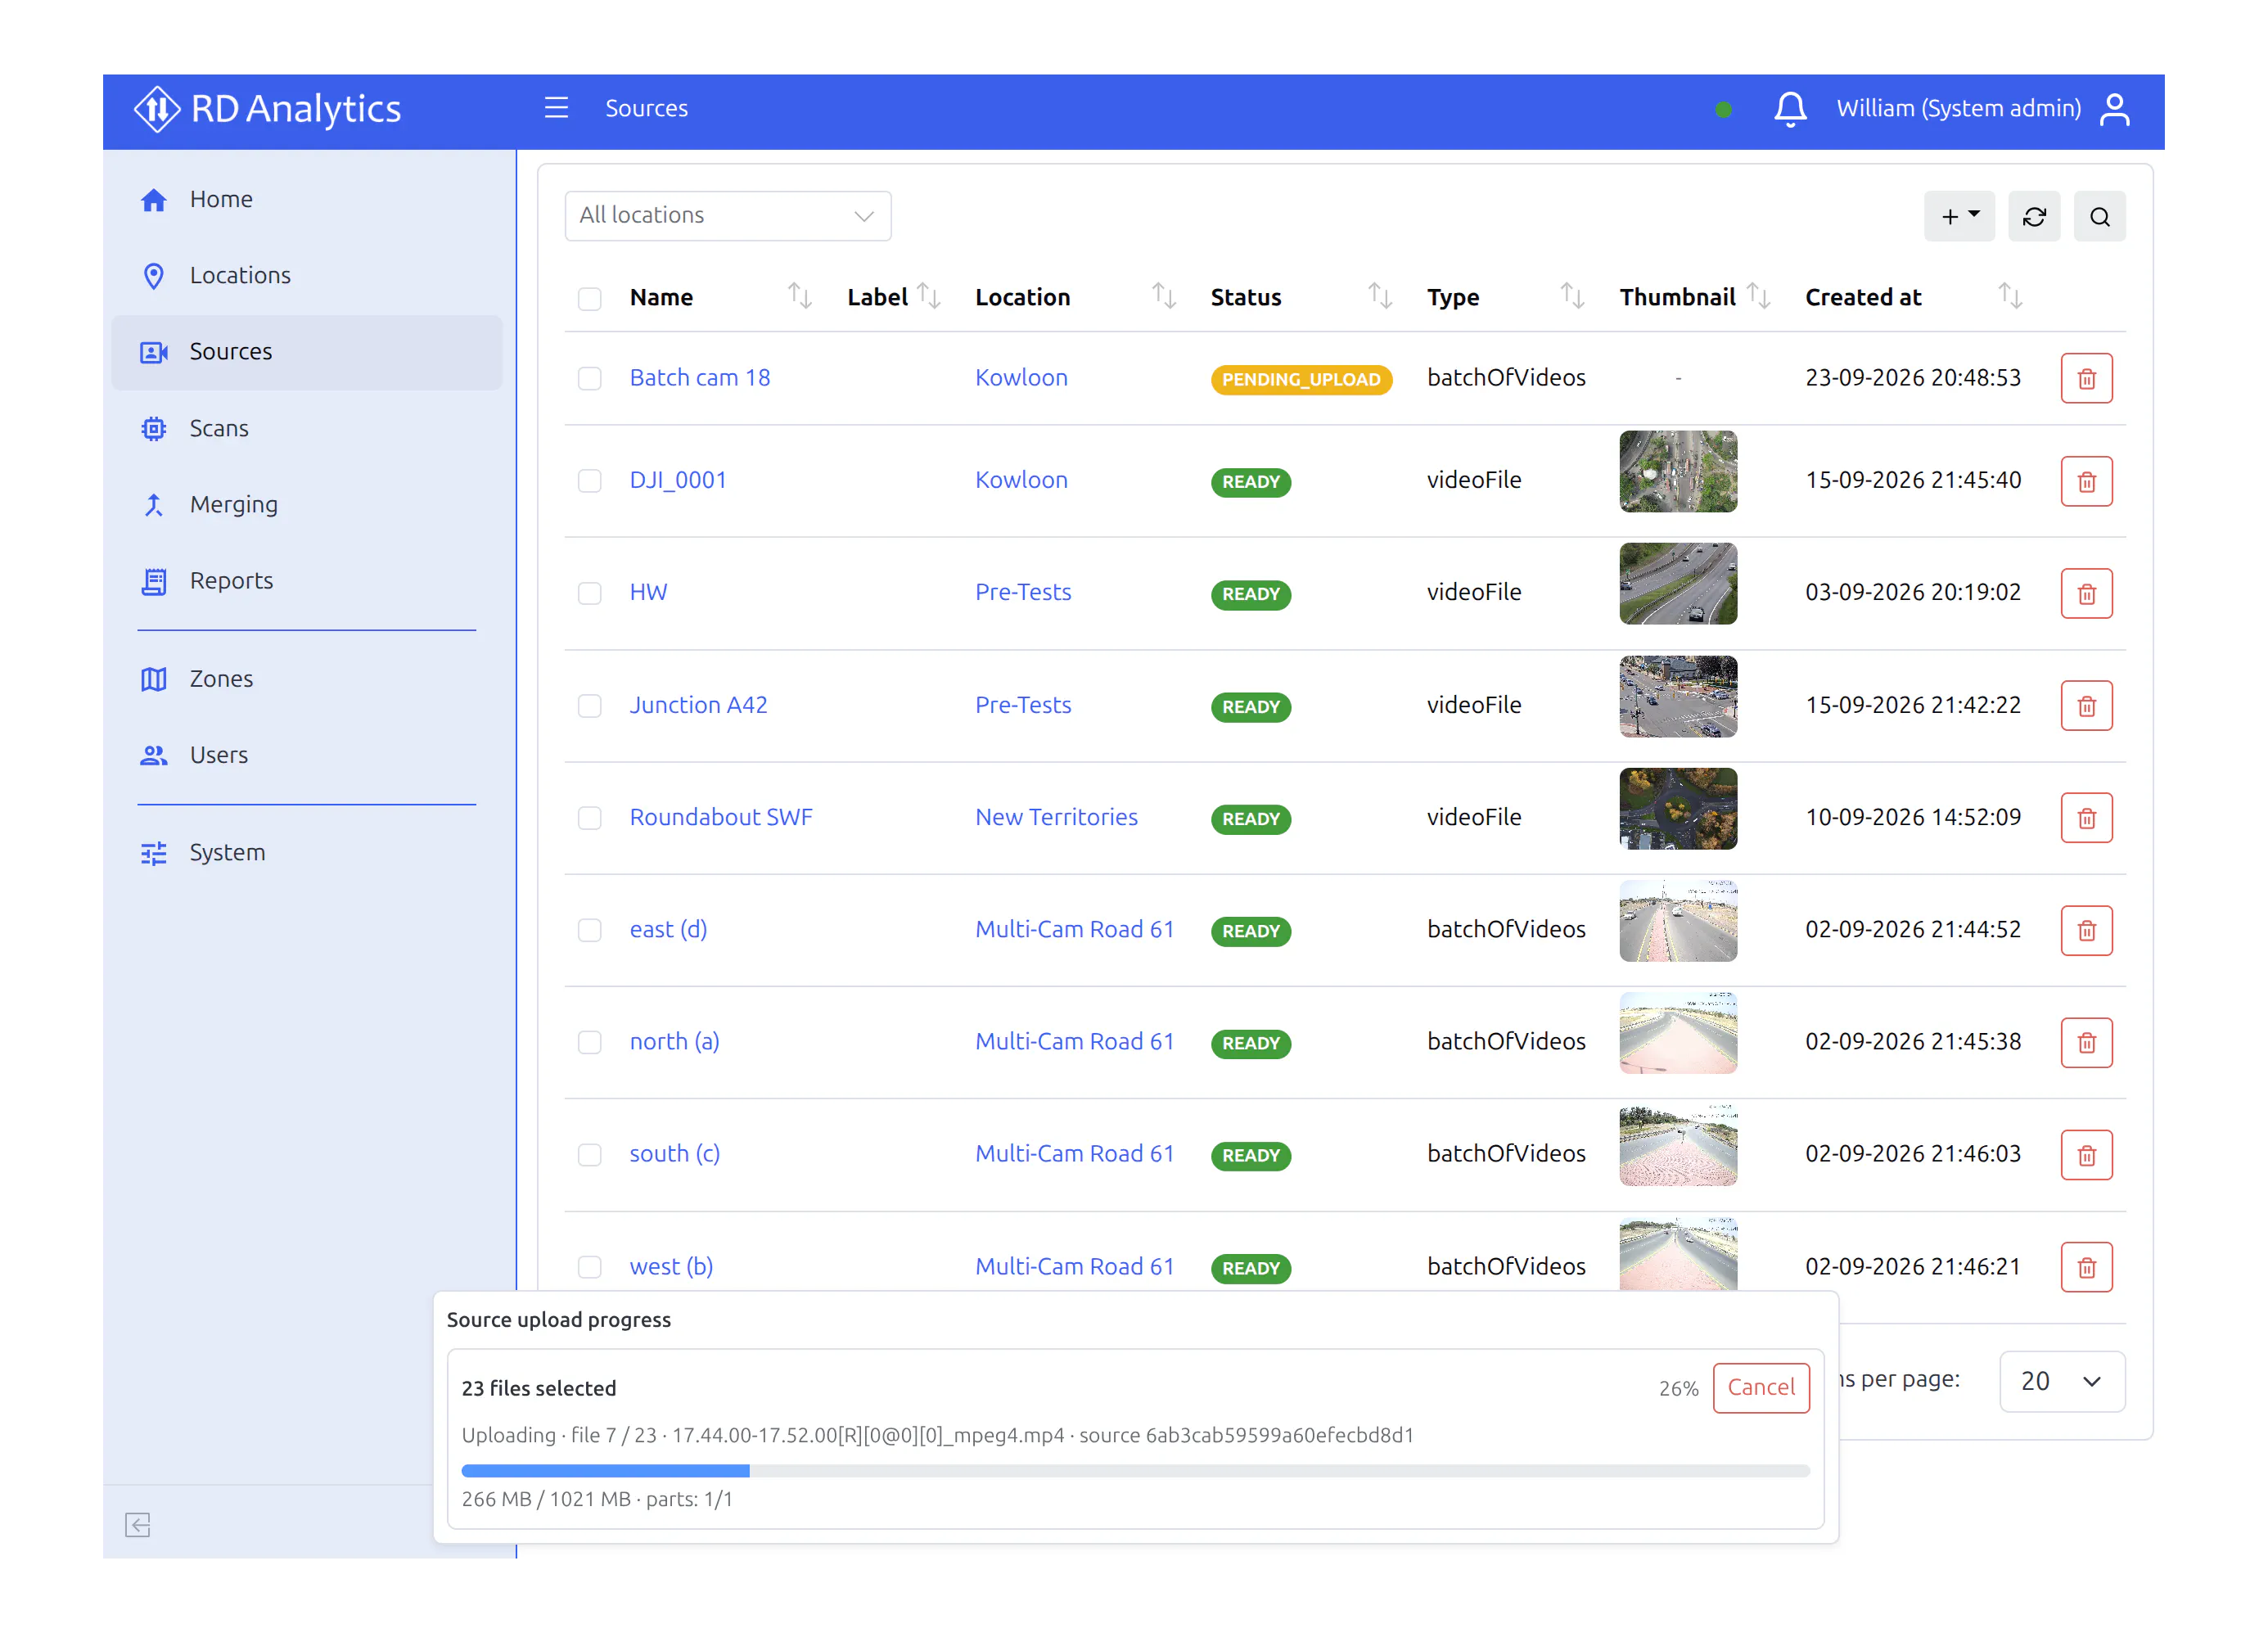
Upload source video and download results through the web interface — no digging through server folders. Add a batch of video files in one step when a full survey day arrives at once.
That change matters operationally: analysts stay in the browser they already use for configuration and reports, instead of asking IT for folder access or copying large dumps over remote desktop. A full day of survey video can be dropped in as a batch; when processed outputs are ready (for example, a recorded result video), they come back through the same Files area. Fewer hand-offs, fewer “where did that file land?” delays.
That change matters operationally: analysts stay in the browser they already use for configuration and reports, instead of asking IT for folder access or copying large dumps over remote desktop. A full day of survey video can be dropped in as a batch; when processed outputs are ready (for example, a recorded result video), they come back through the same Files area. Fewer hand-offs, fewer “where did that file land?” delays.
Automatic fix for corrupted video
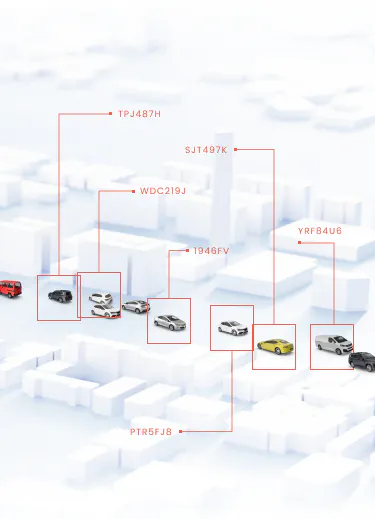
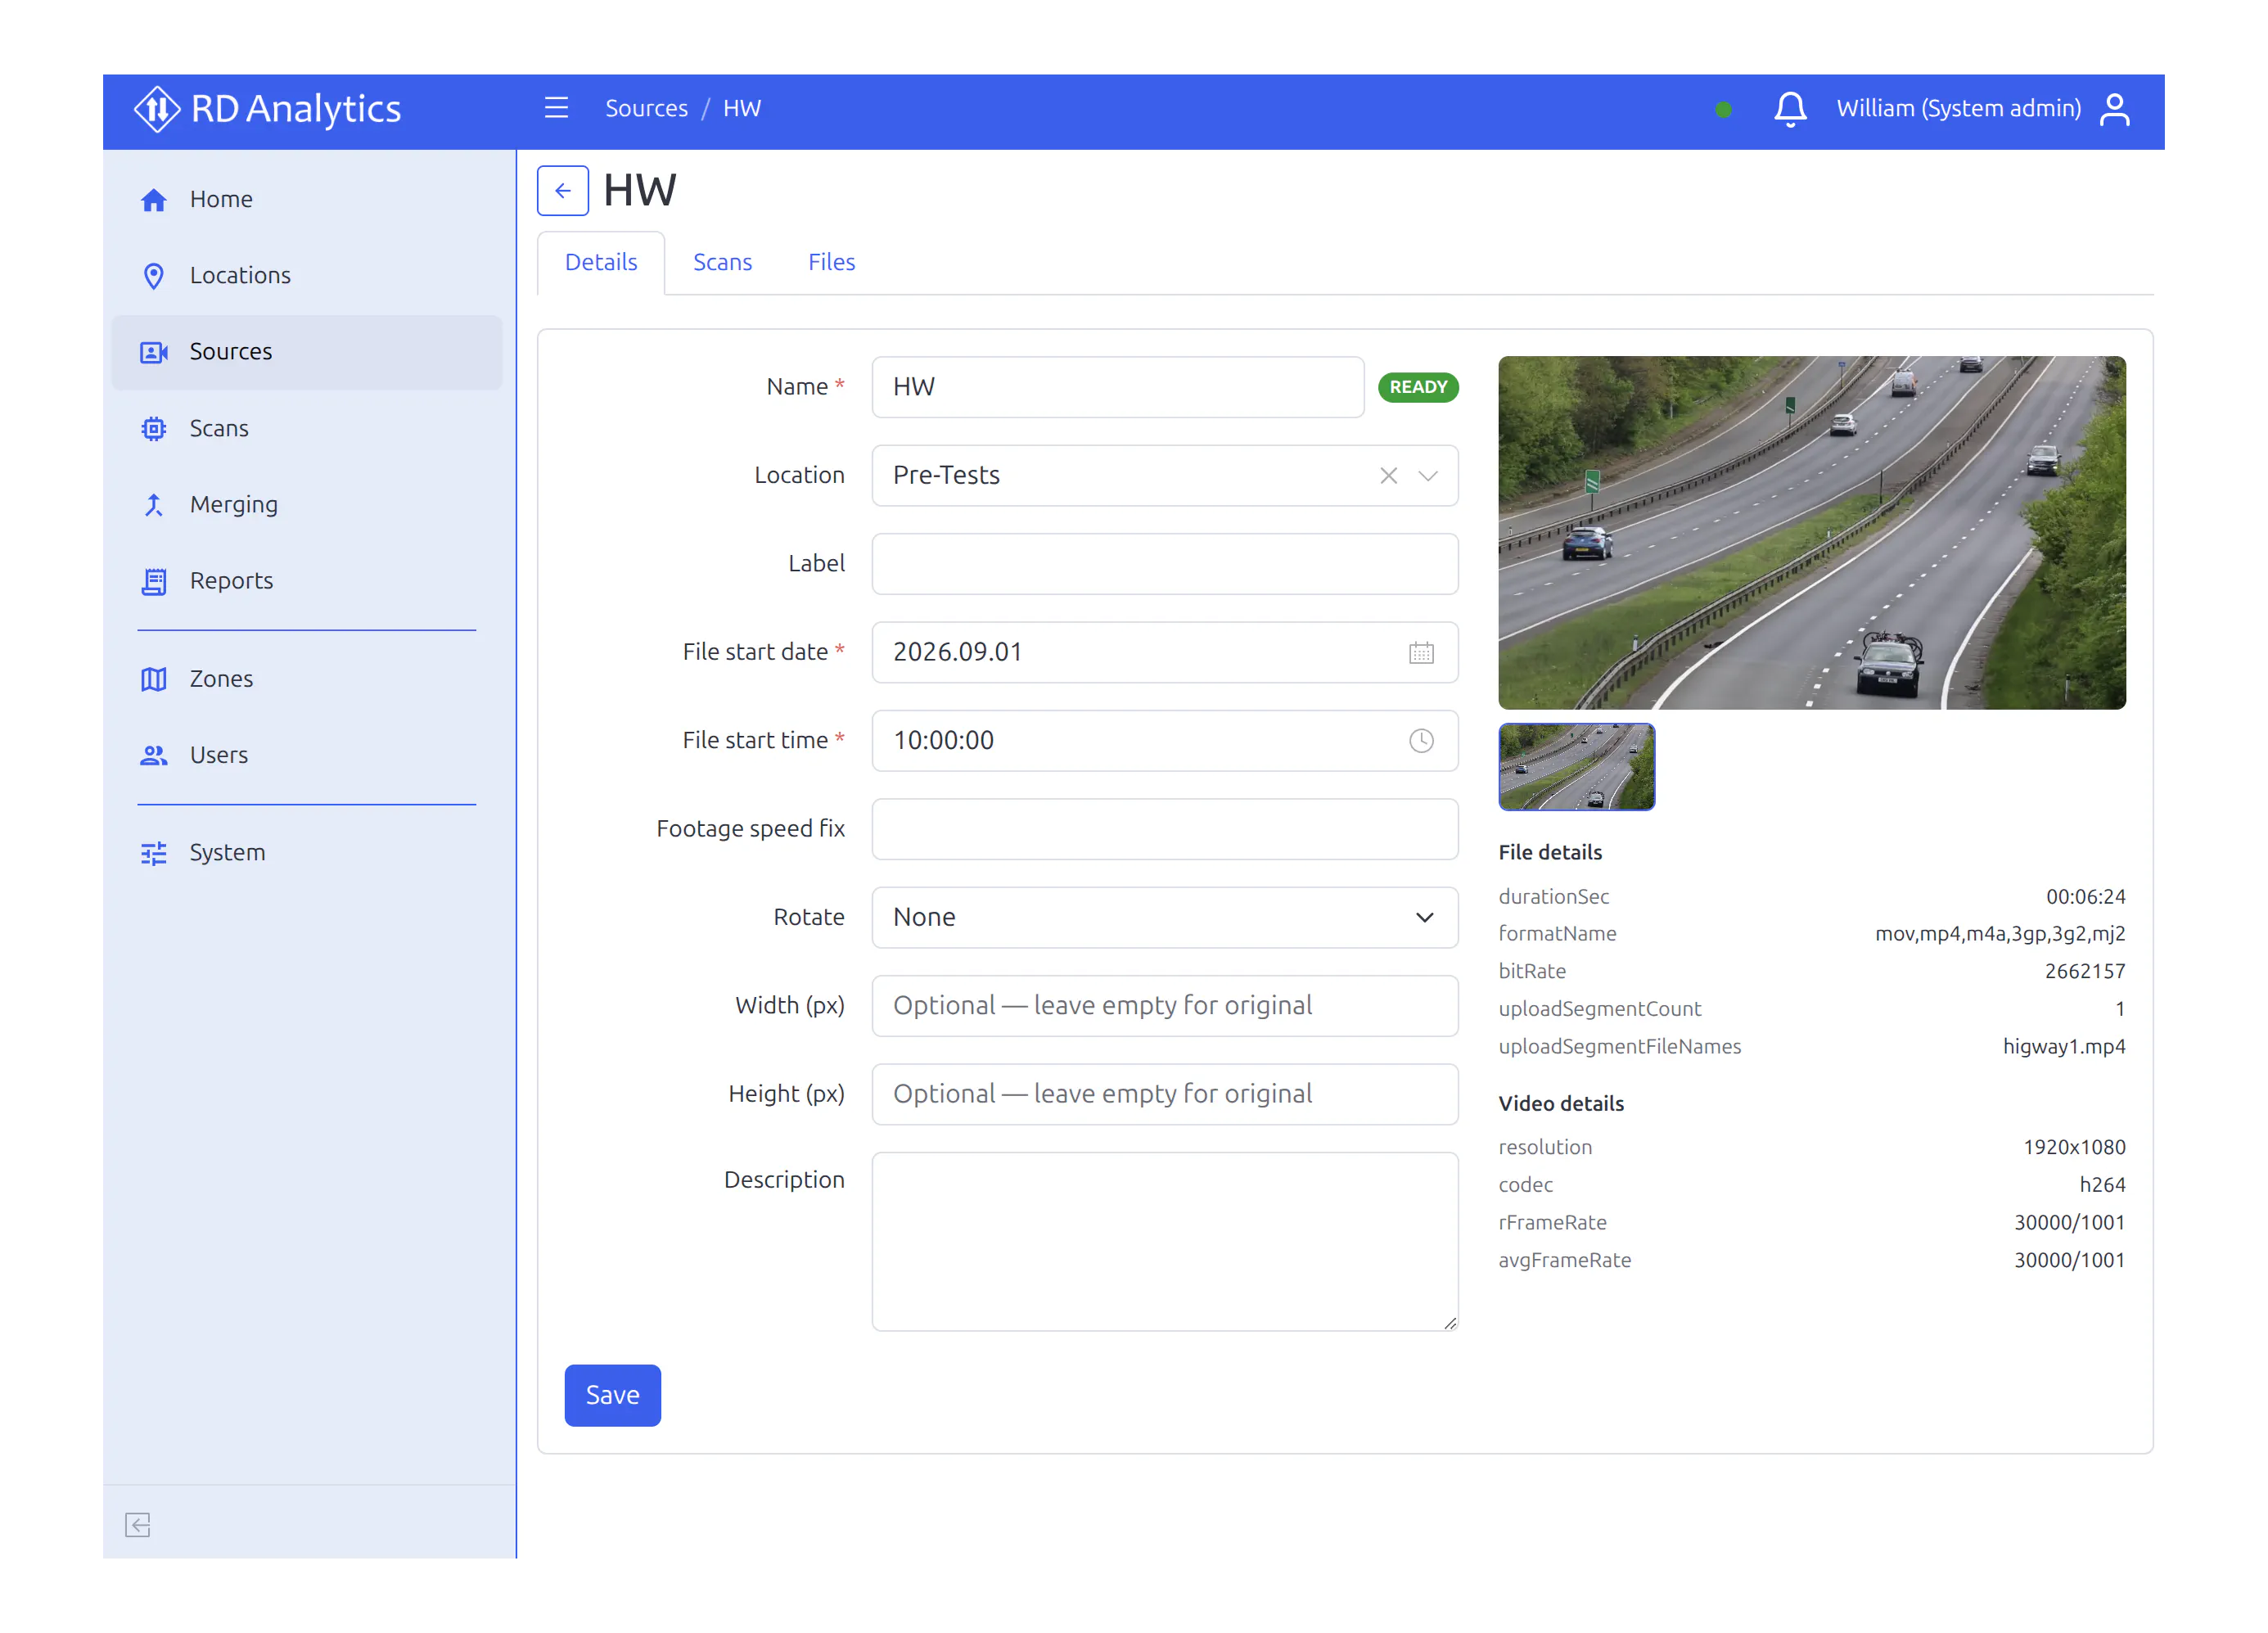
Field recordings often arrive with corrupted blocks. When you add a video, RD Analytics 5 fixes them automatically, so damaged files are far less likely to stop the whole import. That means less time lost chasing “bad” clips from the recorder.
Anyone who has collected roadside video knows this pain: the camera ran for hours, the copy looks fine on a laptop player, then the analysis server rejects the file or stalls mid-way. v5 treats repair as part of adding the source — not as a separate emergency for your video specialist. Severely damaged recordings may still need a re-export from the device, but everyday corruption no longer has to block the whole survey chain.
Anyone who has collected roadside video knows this pain: the camera ran for hours, the copy looks fine on a laptop player, then the analysis server rejects the file or stalls mid-way. v5 treats repair as part of adding the source — not as a separate emergency for your video specialist. Severely damaged recordings may still need a re-export from the device, but everyday corruption no longer has to block the whole survey chain.
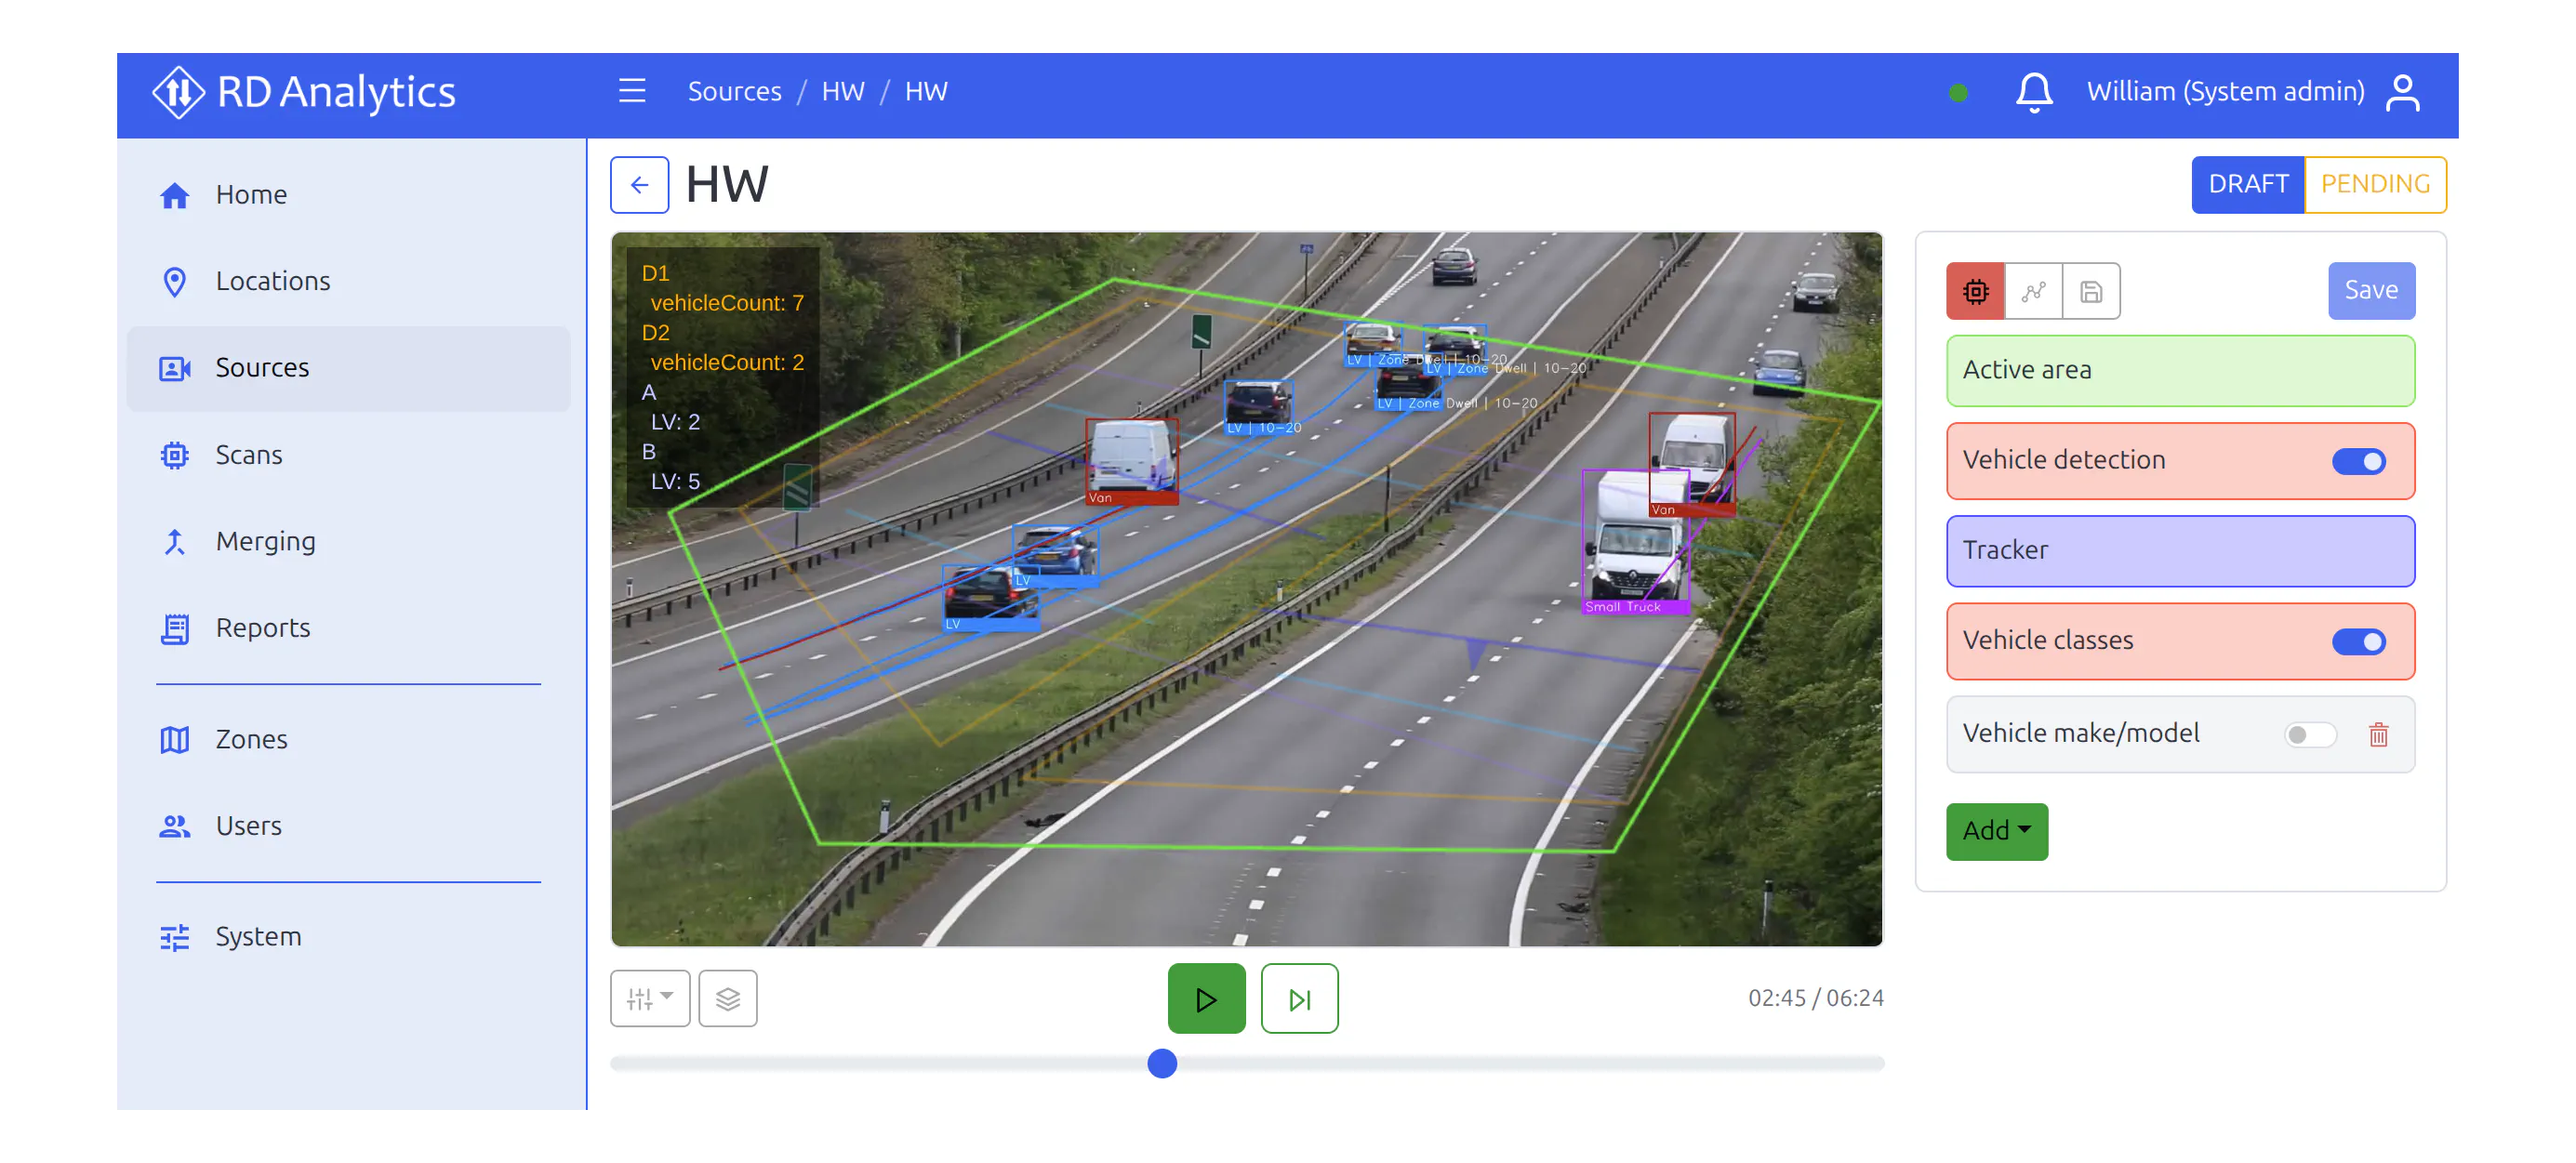
Jump anywhere on the timeline
Use the slider to move back and forth through the video before you commit to a full run. Check day and night segments quickly, spot problem frames, and only then start processing.
Full processing costs machine time. A short scrub through dawn, peak hour, and night tells you whether the camera angle, lighting, or occlusion will cause trouble — before you burn a night of GPU work. You can pause on a difficult frame, adjust counting lines or the active area, and continue with confidence that the setup matches the whole file, not only the opening seconds.
Full processing costs machine time. A short scrub through dawn, peak hour, and night tells you whether the camera angle, lighting, or occlusion will cause trouble — before you burn a night of GPU work. You can pause on a difficult frame, adjust counting lines or the active area, and continue with confidence that the setup matches the whole file, not only the opening seconds.
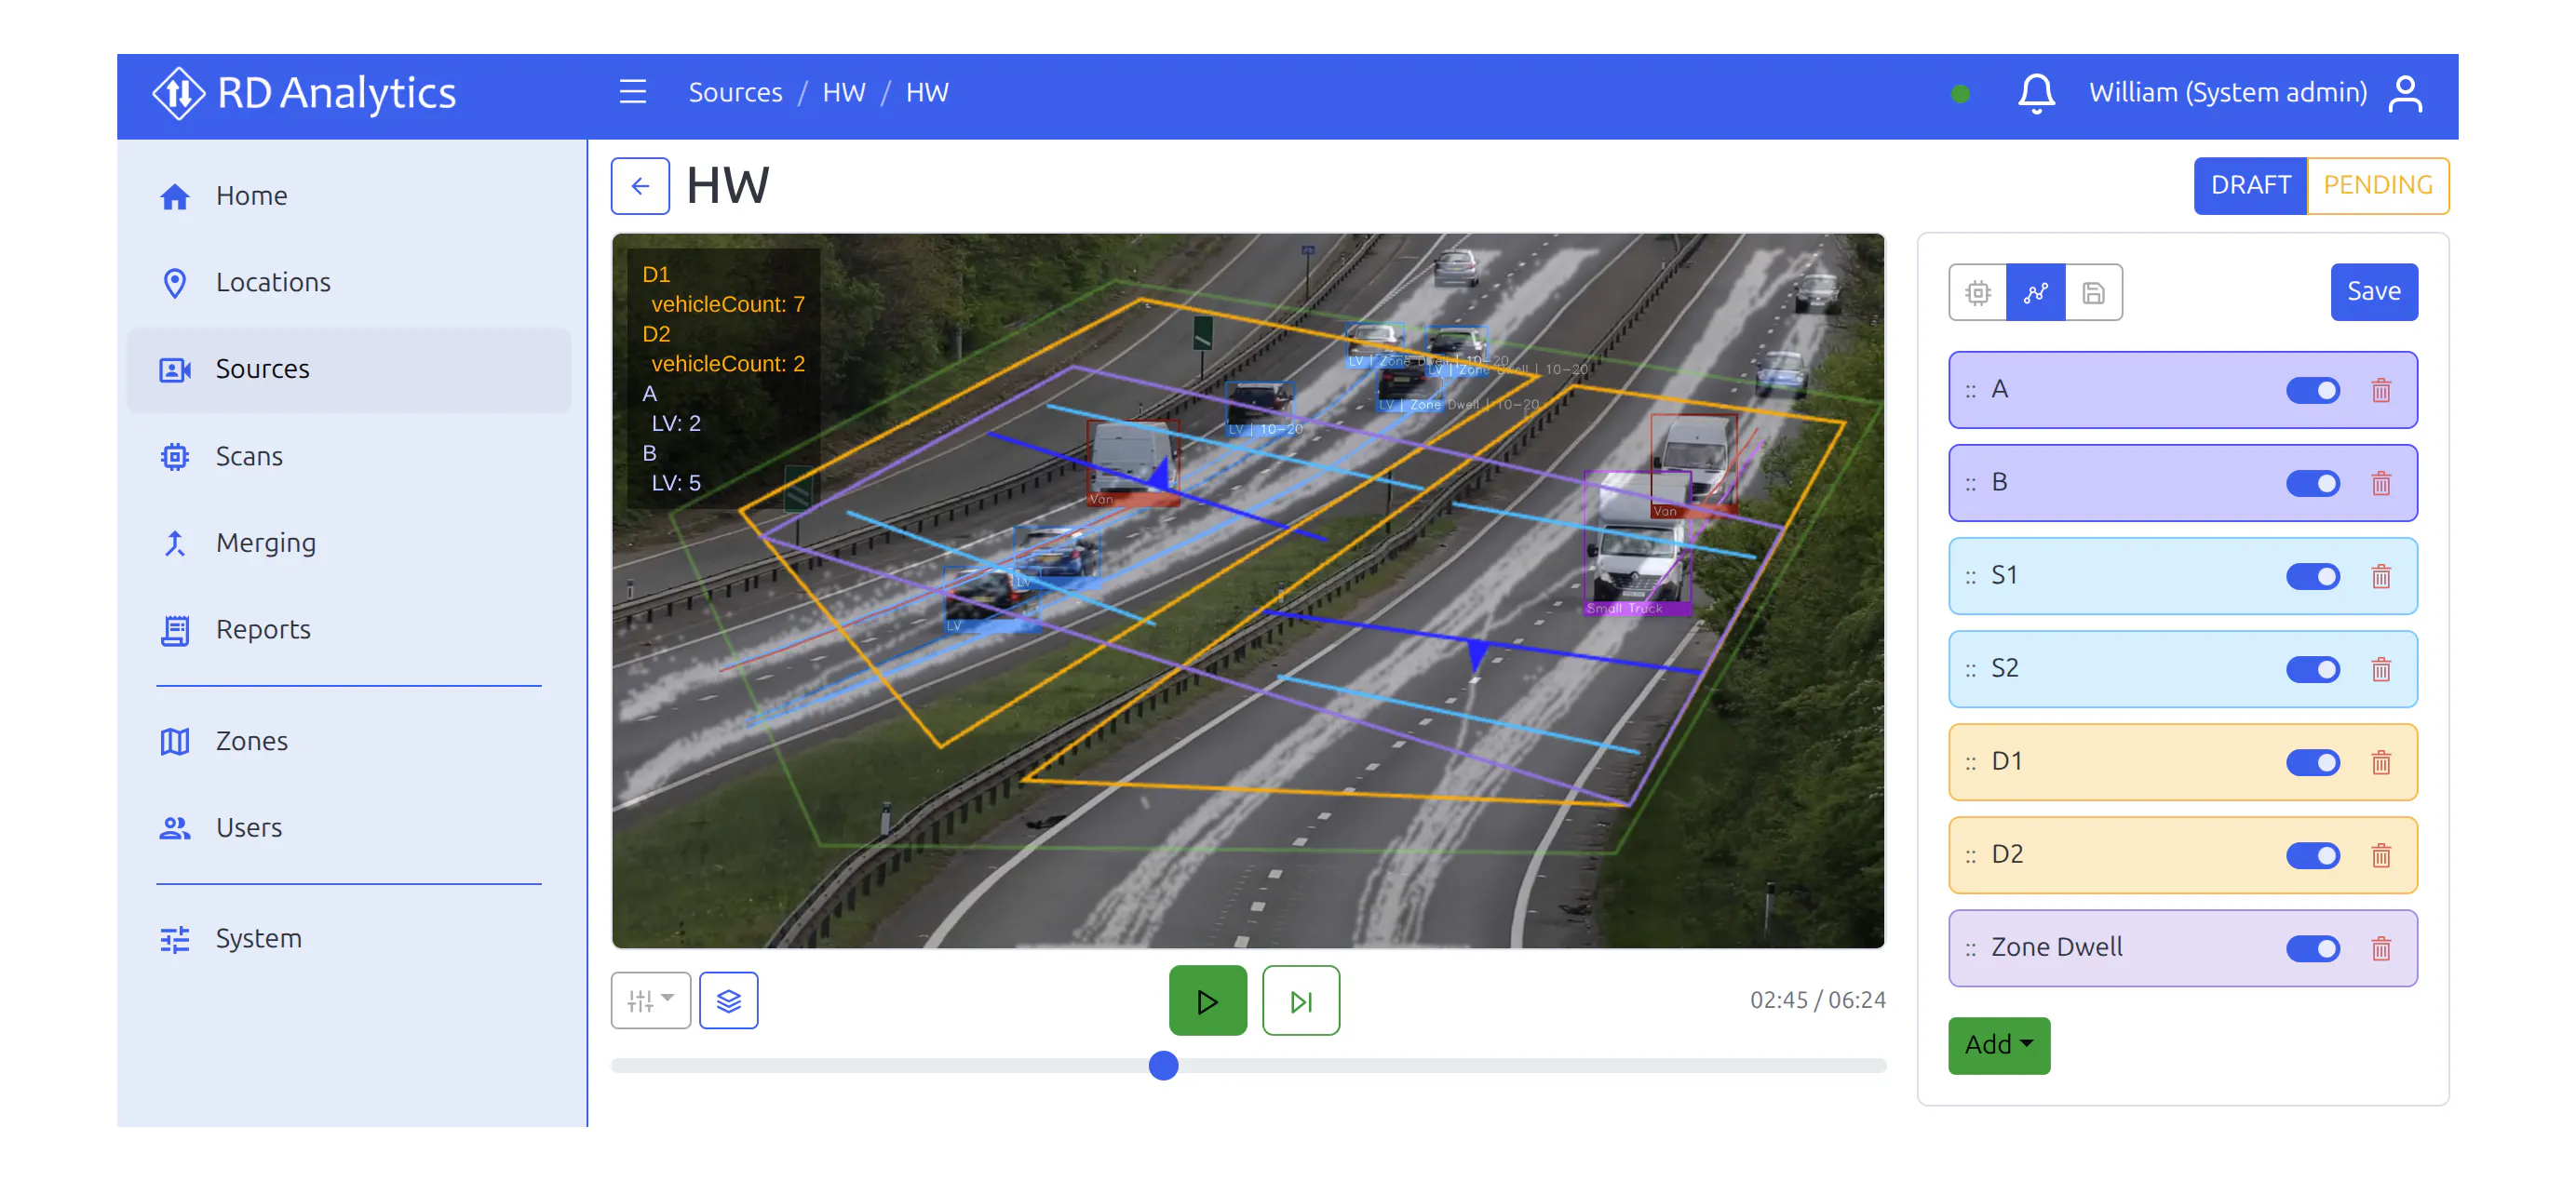
Paths heatmap for counting lines
Overlay a paths heatmap on the scene to see where vehicles actually travel. Counting lines go in the right place the first time — fewer re-runs and more trustworthy counts for the client.
Guessing line position from one still frame is a common source of rework: the line looks fine at noon and misses a lane at dusk, or sits slightly off the real desire line. The heatmap shows the paths the traffic already took, so placement becomes evidence-based. That is especially helpful for new staff and for complex junctions where several movements share the frame.
Guessing line position from one still frame is a common source of rework: the line looks fine at noon and misses a lane at dusk, or sits slightly off the real desire line. The heatmap shows the paths the traffic already took, so placement becomes evidence-based. That is especially helpful for new staff and for complex junctions where several movements share the frame.
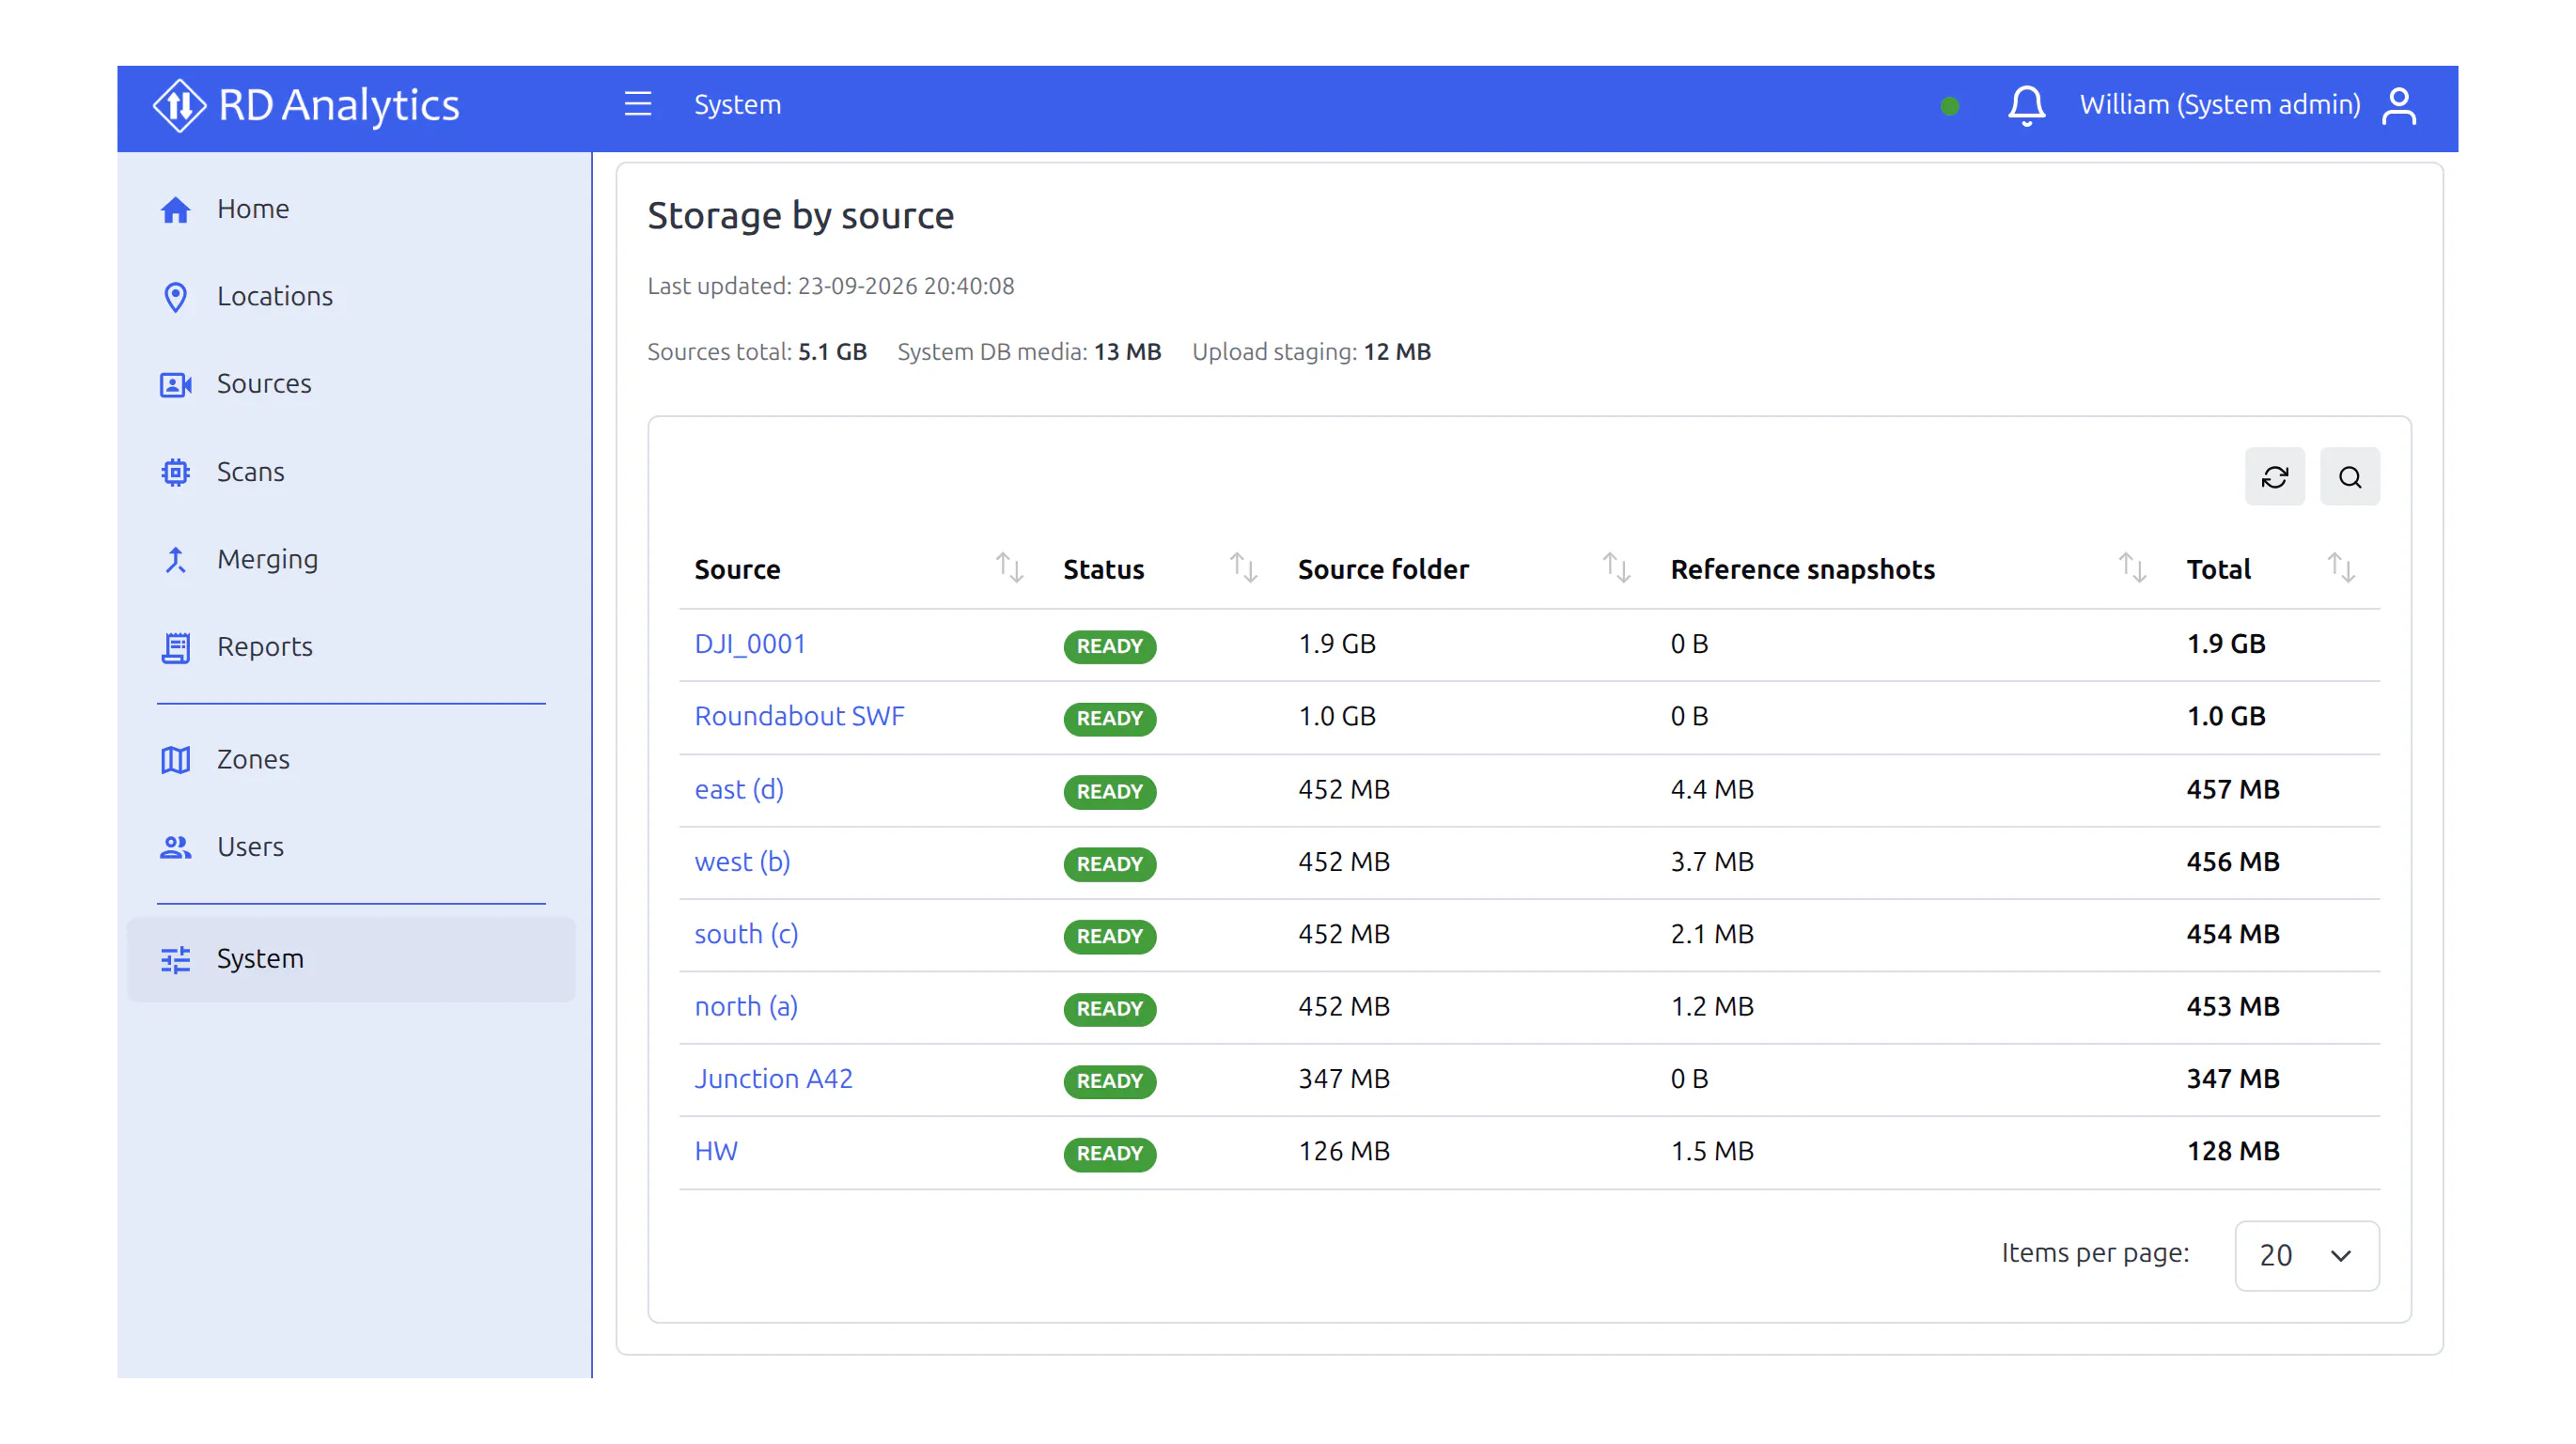
Maintenance — disk and database size
Improved Maintenance views show disk use and database size at a glance. Admins can spot capacity issues before a busy survey week — not after the system runs out of space mid-project.
Survey archives grow quietly: raw video, snapshots, and result data accumulate over months. Without a clear control screen, capacity problems surface as failed jobs or slow reports at the worst moment. Maintenance brings used space and database size into the same place admins already manage the system — so cleanup and disk planning become routine, not a fire drill.
Survey archives grow quietly: raw video, snapshots, and result data accumulate over months. Without a clear control screen, capacity problems surface as failed jobs or slow reports at the worst moment. Maintenance brings used space and database size into the same place admins already manage the system — so cleanup and disk planning become routine, not a fire drill.
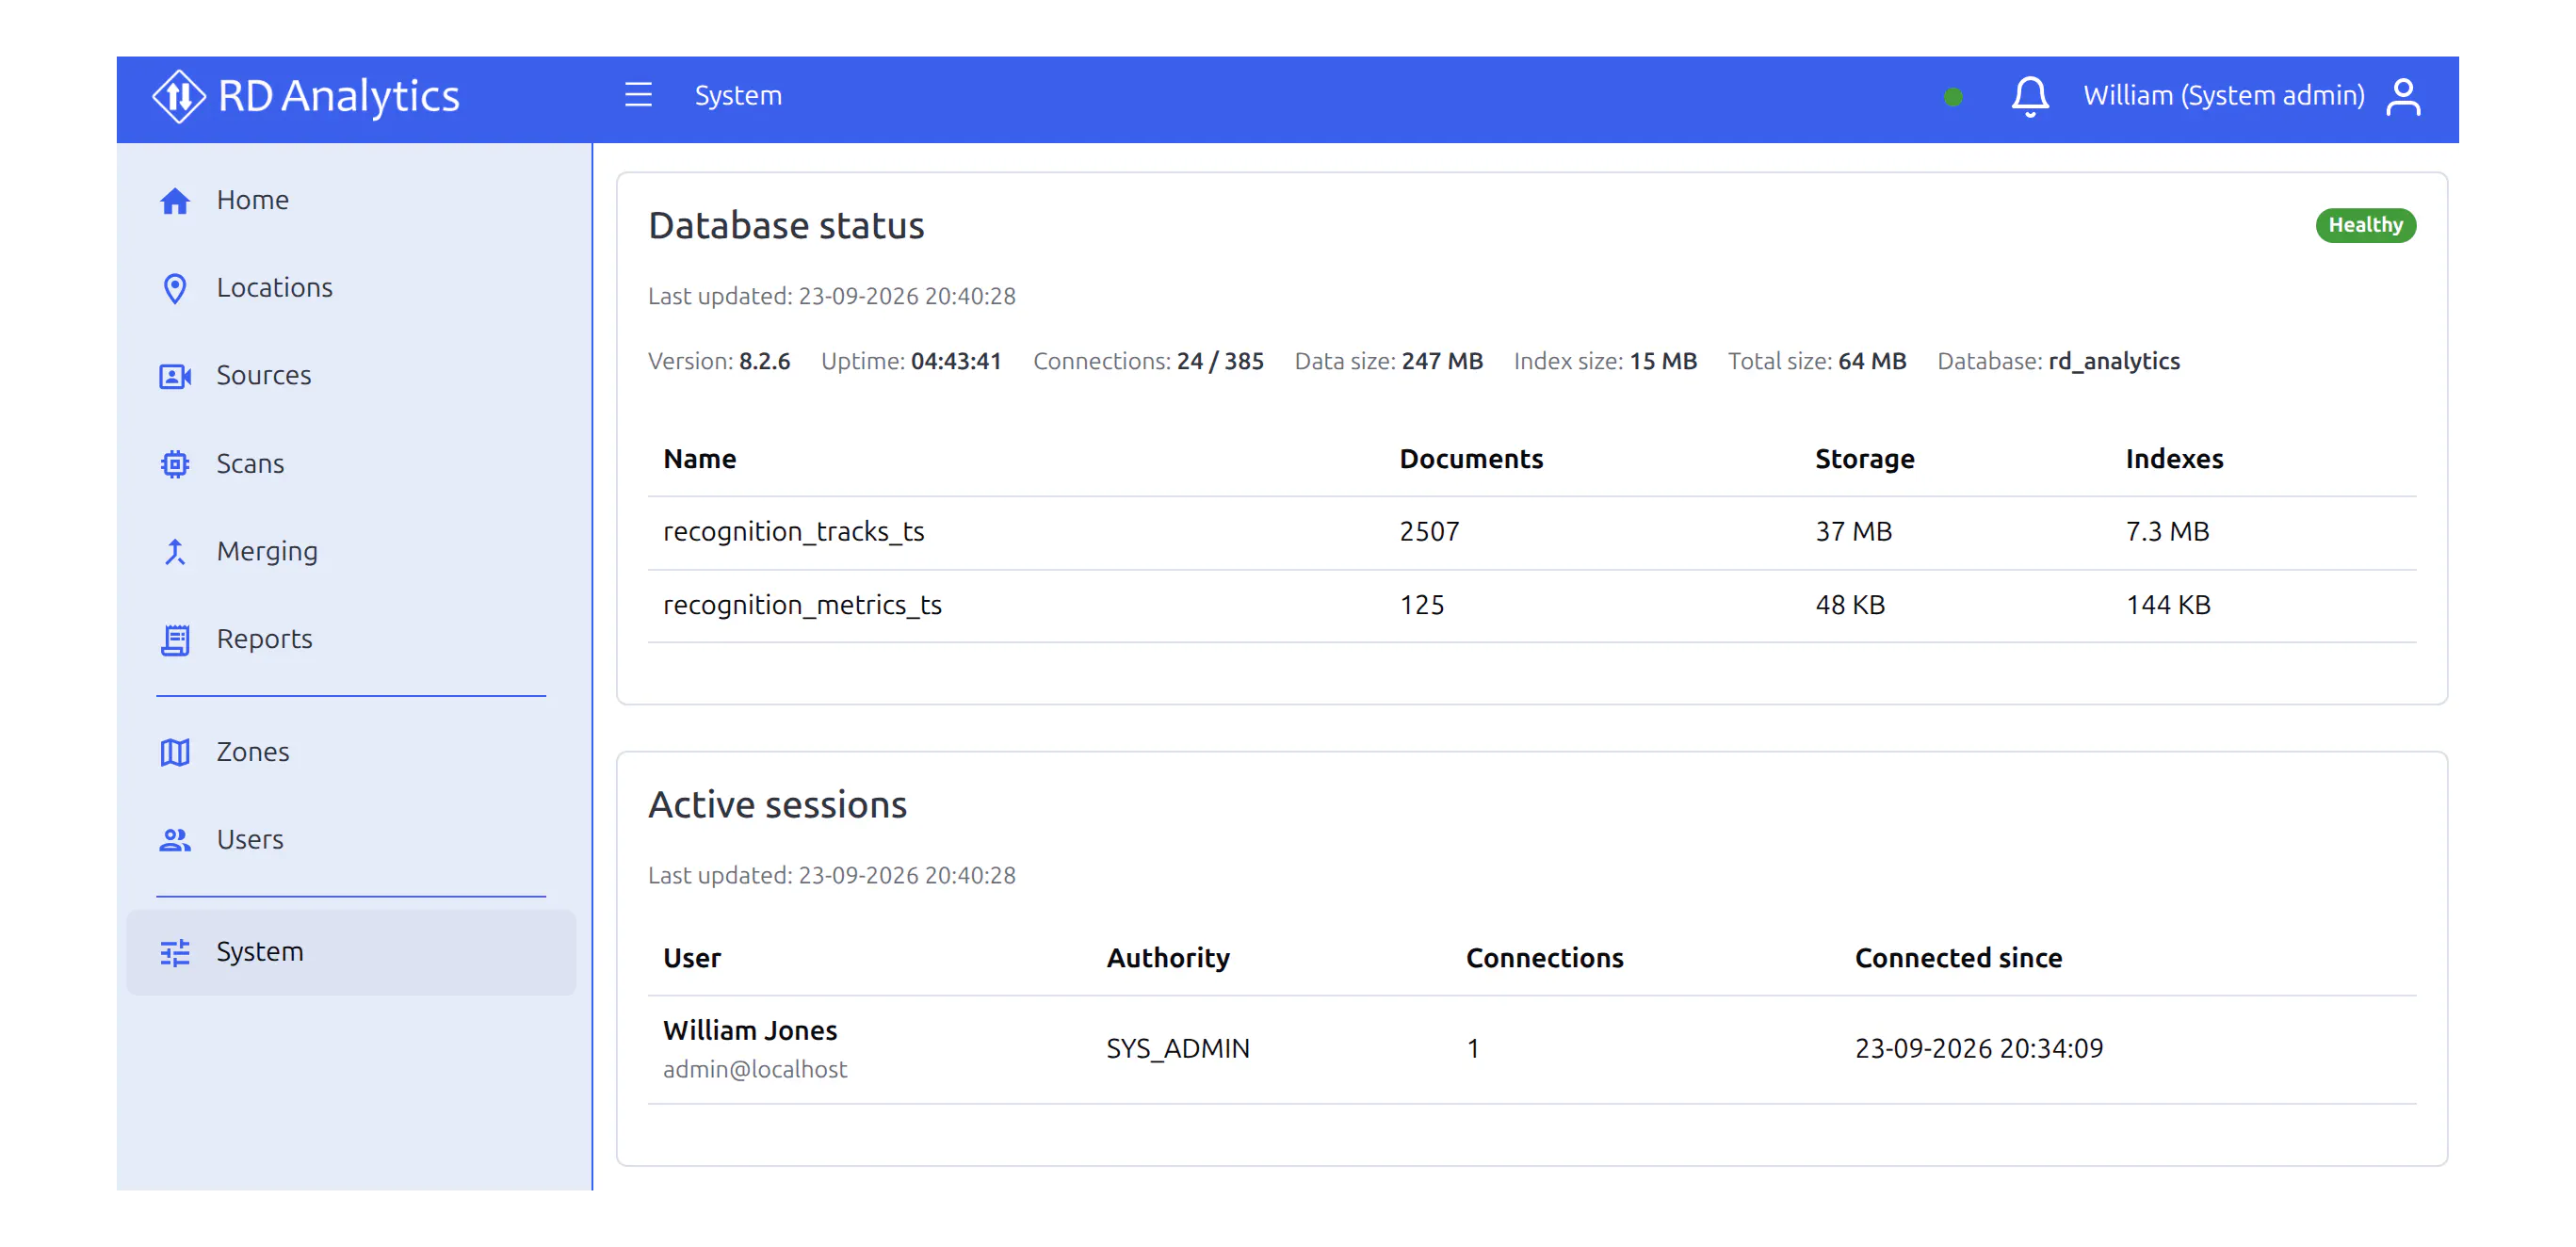
Faster reports on large databases
Reports stay responsive even when you already store large volumes of traffic data. Teams spend less time waiting for charts and tables when the archive grows after months of surveys.
Long-running projects are exactly where this shows: last year’s corridors and this month’s junctions live in one place, and stakeholders still expect quick answers. Faster report building on large databases means less “export everything and wait” behaviour, and more interactive checking of counts, classes, and time ranges while the conversation with the client is still open.
Long-running projects are exactly where this shows: last year’s corridors and this month’s junctions live in one place, and stakeholders still expect quick answers. Faster report building on large databases means less “export everything and wait” behaviour, and more interactive checking of counts, classes, and time ranges while the conversation with the client is still open.
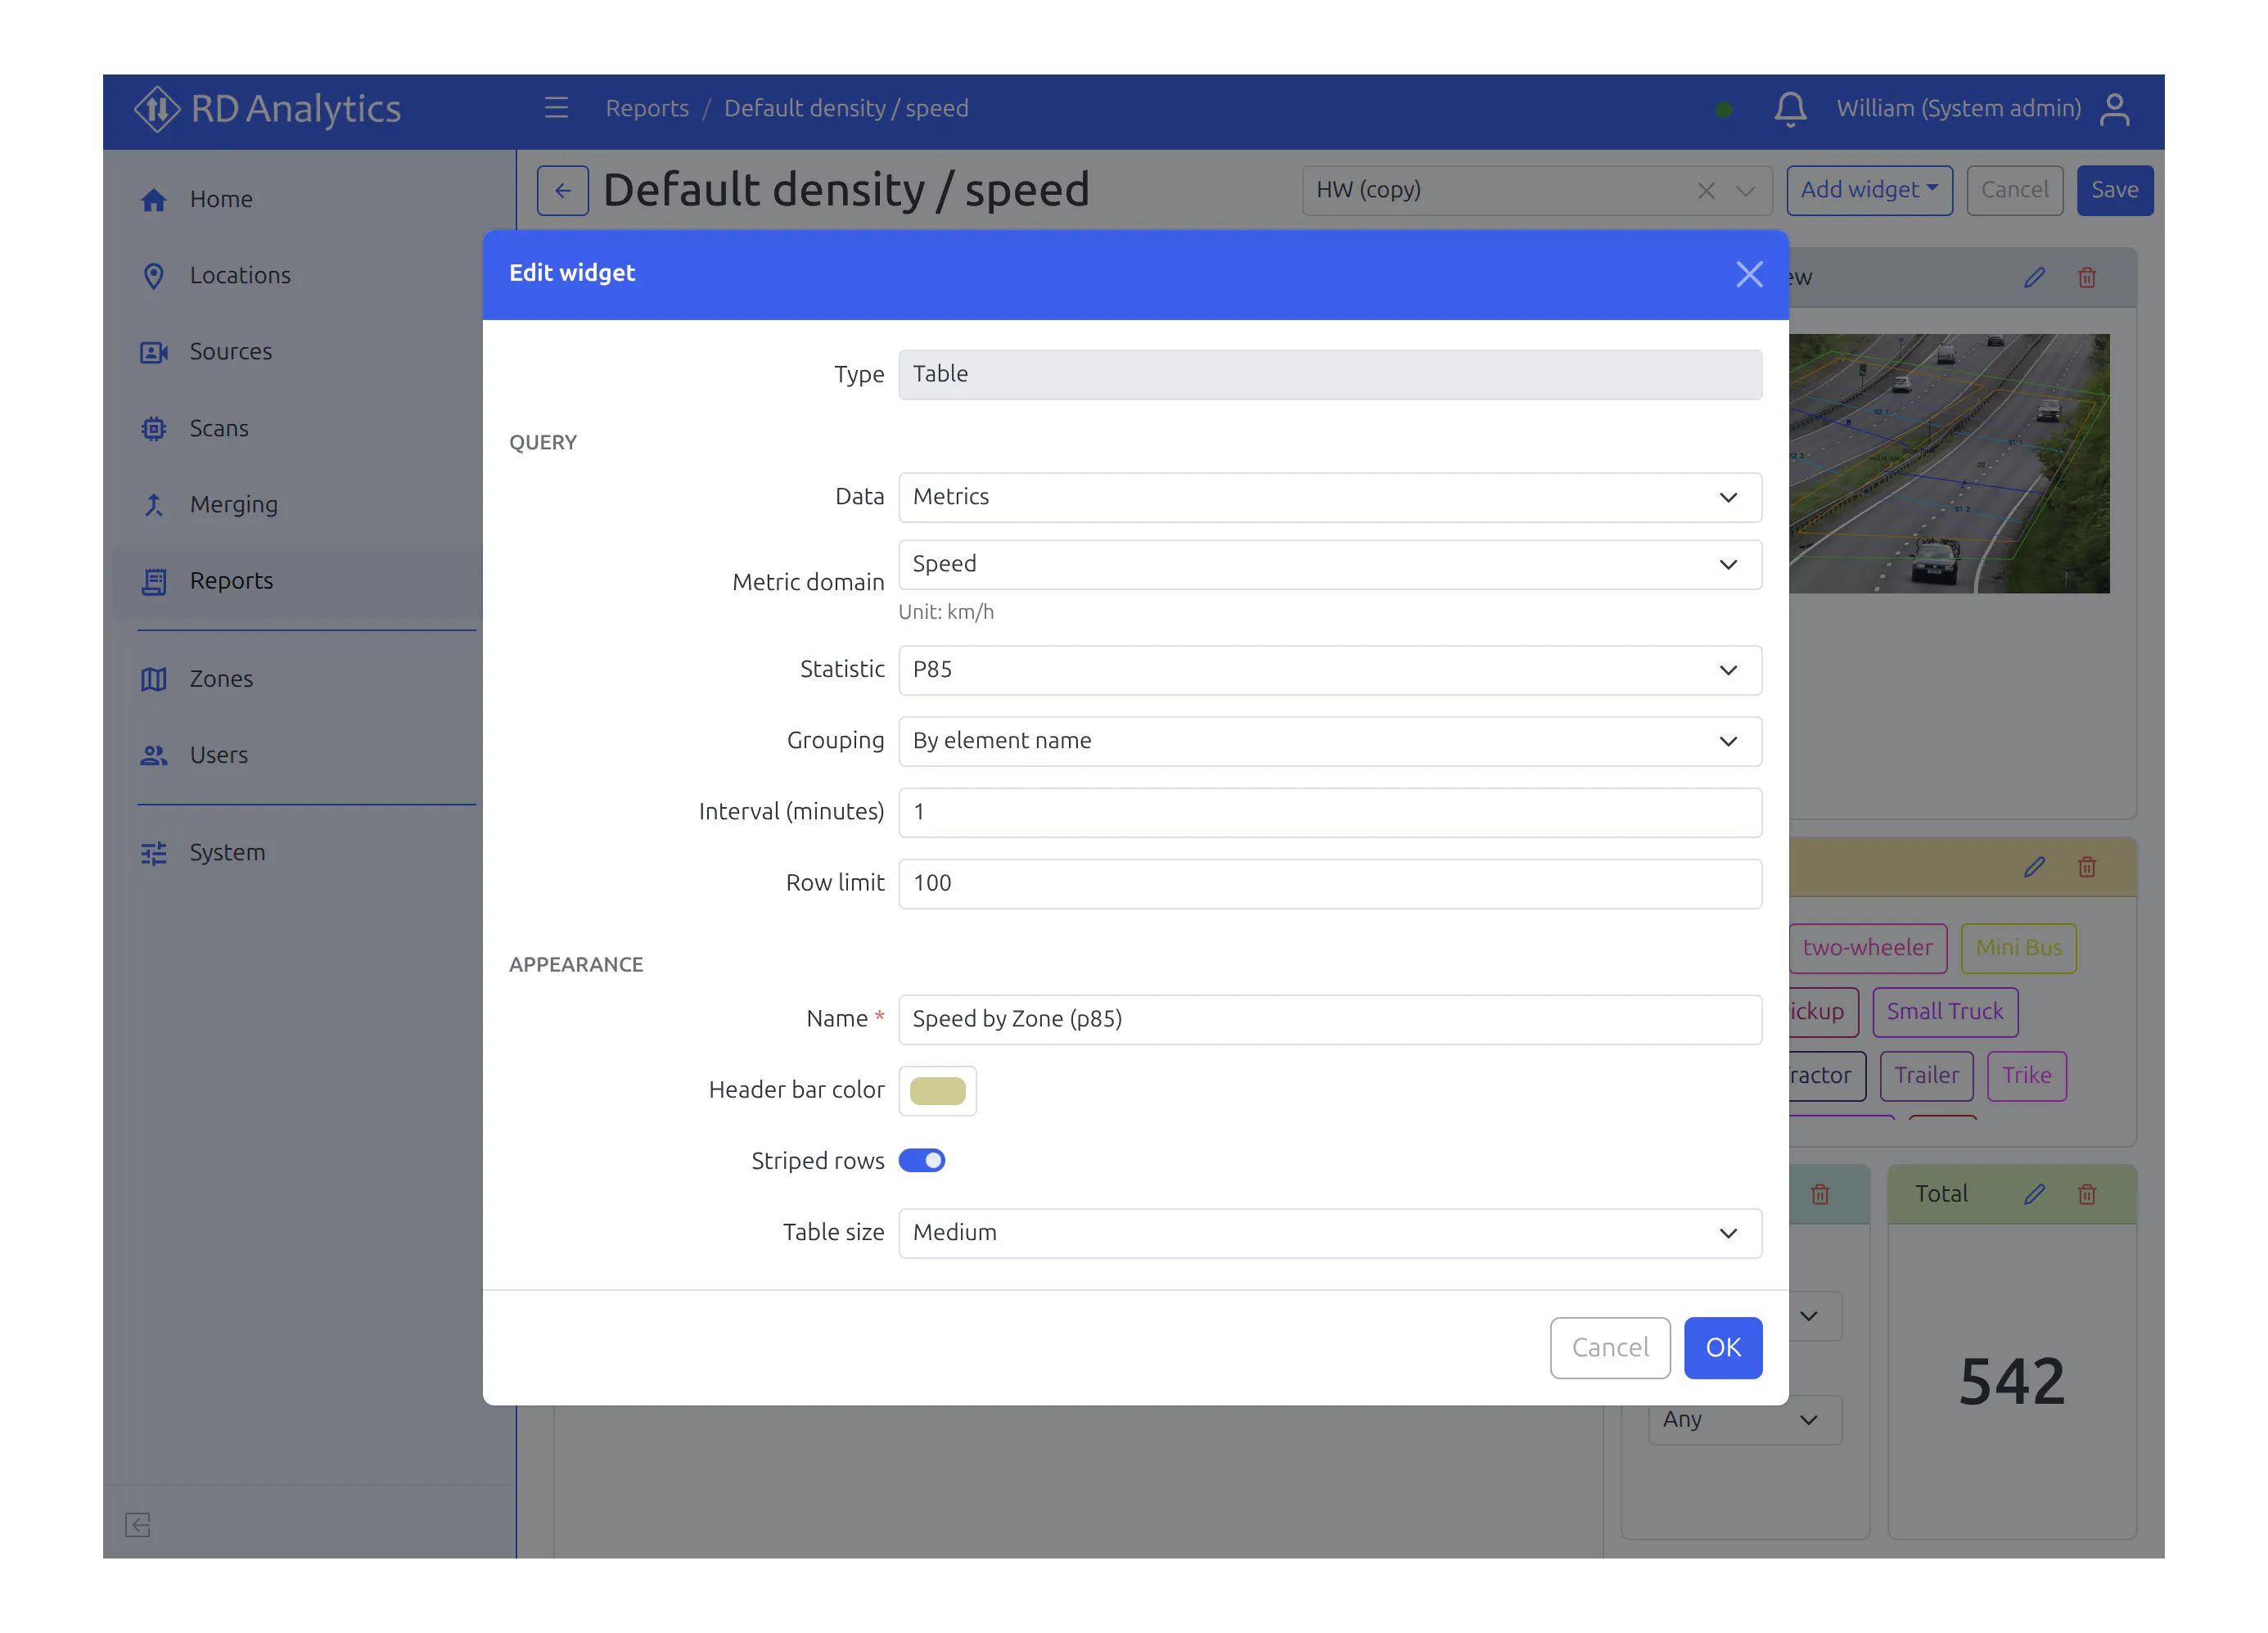
Speed bins, P50, and P85
Group measured speeds into clear bins and report P50 and P85 percentiles alongside the usual averages. These are the figures traffic engineers and clients already expect in speed studies — ready to use in proposals and deliverables.
Average speed alone often hides the story: a calm median with a long tail of fast vehicles, or the opposite. Bins show the distribution; P50 and P85 match how speed surveys are written up for authorities and design teams. You measure with the familiar two reference lines and a real-world distance — then present results in the language your audience already uses.
Average speed alone often hides the story: a calm median with a long tail of fast vehicles, or the opposite. Bins show the distribution; P50 and P85 match how speed surveys are written up for authorities and design teams. You measure with the familiar two reference lines and a real-world distance — then present results in the language your audience already uses.
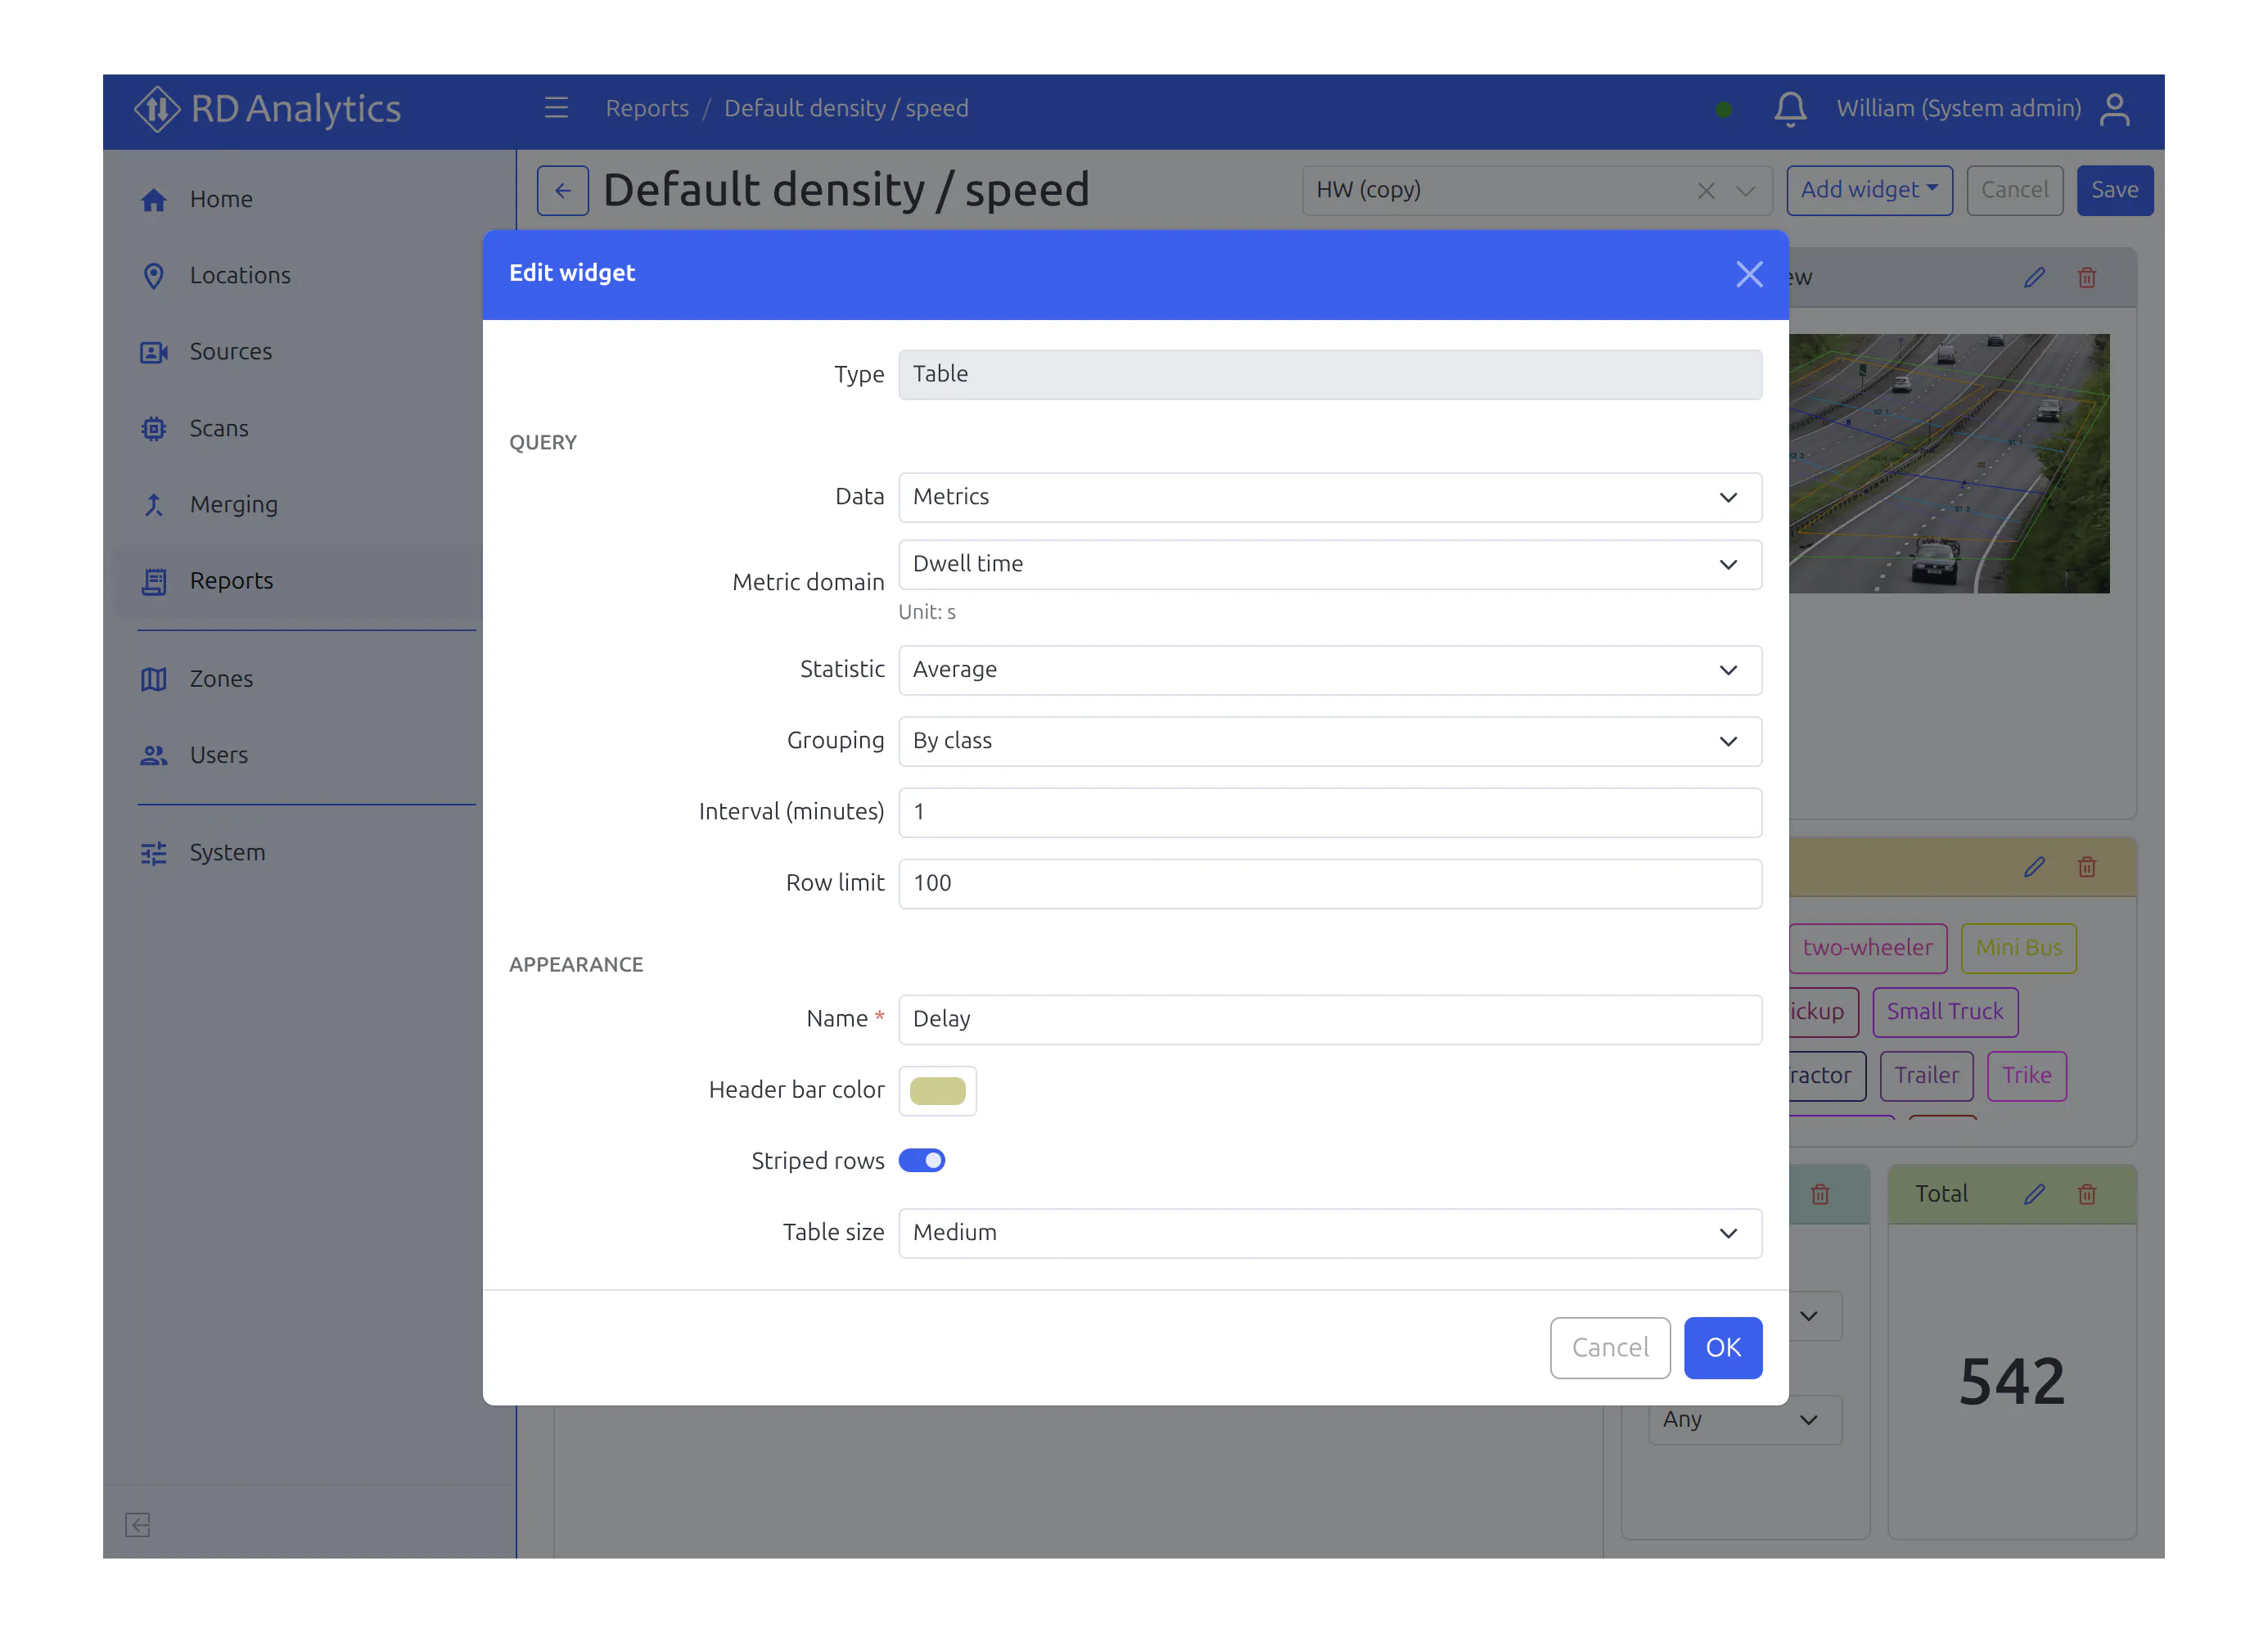
Duration report
See how long vehicles stay in a chosen area — queues, parking, or stop delay — as a duration (dwell) report. You answer “how long did they wait?” without exporting raw tracks into another tool.
Draw the area that matters — approach queue, drop-off bay, stop line zone — and report how long objects remain inside it. That supports questions counting lines alone cannot answer: delay at a signal, occupancy of a short bay, or time spent in a conflict area. Results stay inside the same reporting workspace as your counts and speed figures, so one study package covers more of the brief.
Draw the area that matters — approach queue, drop-off bay, stop line zone — and report how long objects remain inside it. That supports questions counting lines alone cannot answer: delay at a signal, occupancy of a short bay, or time spent in a conflict area. Results stay inside the same reporting workspace as your counts and speed figures, so one study package covers more of the brief.
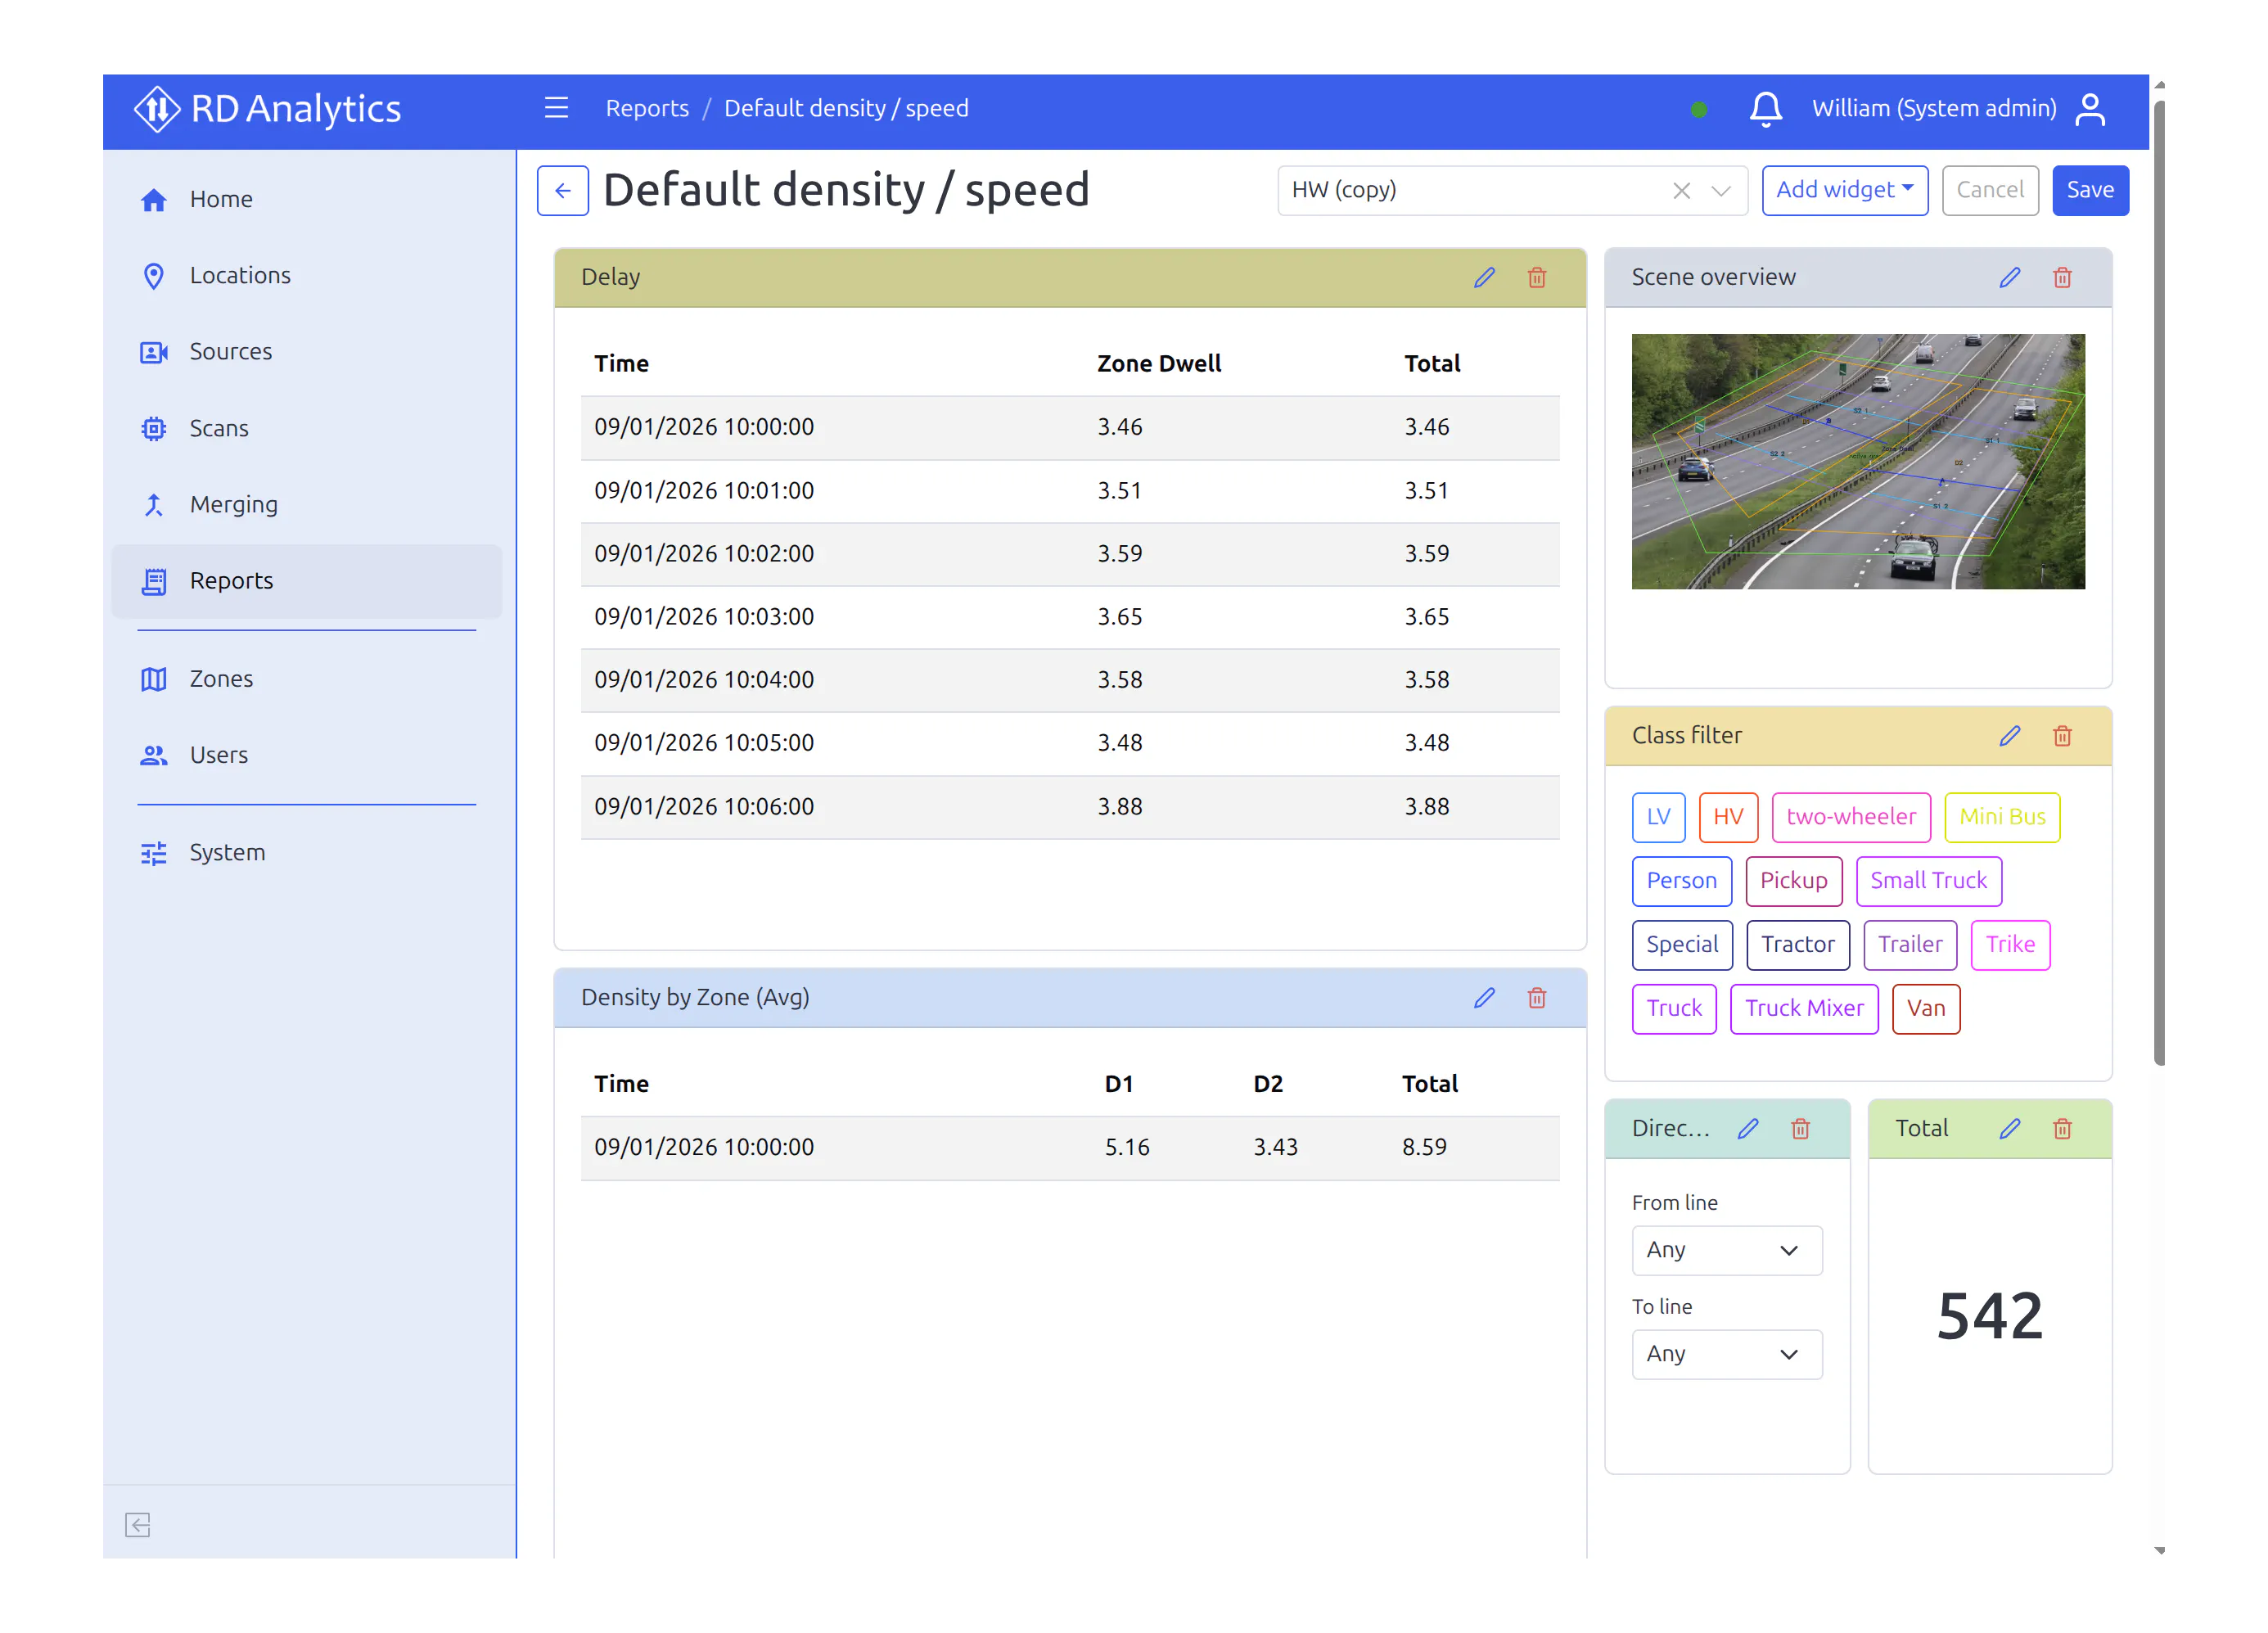
Scene overview on reports
On the Reports screen, the Scene overview widget shows the layout with counting lines and zone names. Anyone reading the report can see what was counted without opening the setup screen — clearer deliverables for clients and reviewers.
Numbers without geometry invite doubt: which line was “North”? where was the dwell zone? Scene overview puts a labelled reference image next to the tables and charts, so the report explains itself. That saves back-and-forth in reviews and makes exported packages easier to hand to someone who never opened the configuration UI.
Numbers without geometry invite doubt: which line was “North”? where was the dwell zone? Scene overview puts a labelled reference image next to the tables and charts, so the report explains itself. That saves back-and-forth in reviews and makes exported packages easier to hand to someone who never opened the configuration UI.
Ready to move to RD Analytics 5?
Send a sample clip or book a short walkthrough — we’ll run a first pilot on your video and answer the questions that matter for your team.