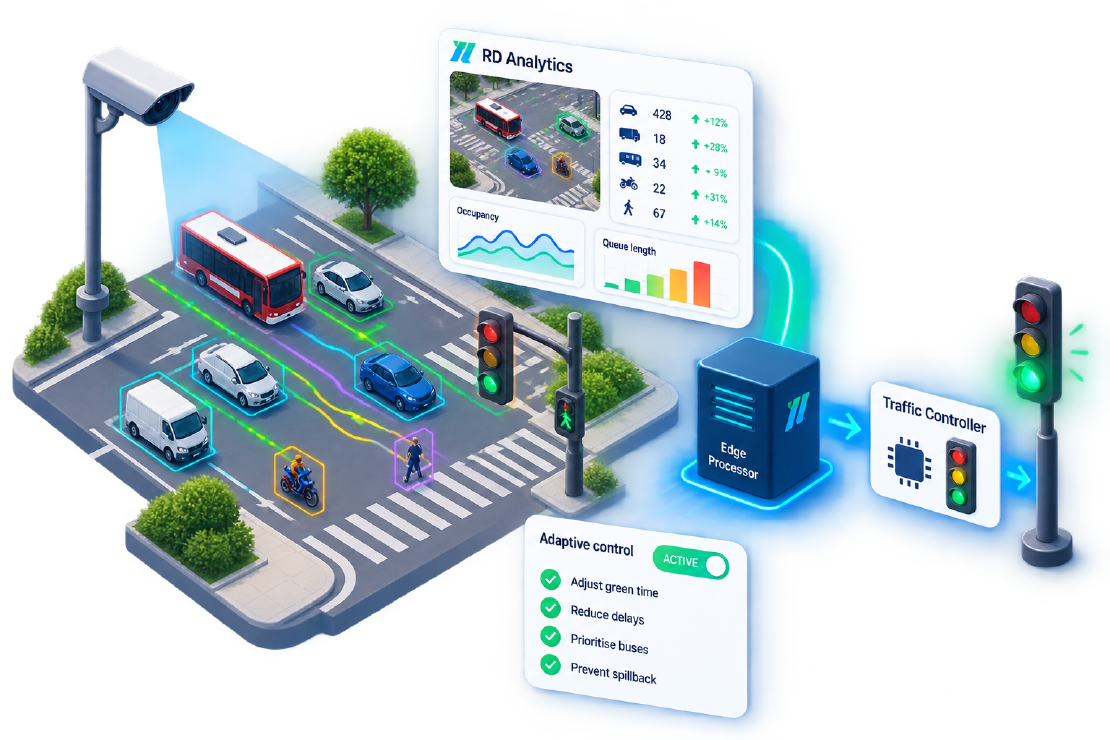
Fixed-time signals waste green when demand shifts. Adaptive traffic signal AI systems adjust phases using detectors—historically loops and, increasingly, cameras. Video-analytics traffic-light programmes from other video-analytics vendors (including adaptive camera deployments in European cities) show the pattern: turn live video into structured demand, then let the controller optimise.
This article explains how video-derived measures feed adaptive control, what RD Analytics contributes as the analytics layer, and how to pilot without boiling the ocean.
What adaptive control needs from sensors
Controllers and optimisation software typically consume:
| Input | Role |
|---|---|
| Approach occupancy / queue proxy | Extend or cut green |
| Arrival flow / counts by movement | Estimate demand |
| Saturation / spillback flags | Protect upstream junctions |
| Priority requests (bus, emergency) | Special phases |
| Fault / incident hints | Fallback timing |
Loops provide occupancy well where installed. Video adds multimodal demand, stop-line queues visible as density zones, and richer classification (e.g. bus vs car) without new cuts in the asphalt.
Where video analytics sits in the stack
Cameras → Video analytics (counts, occupancy, speed, events)
                → Intersection controller / ATCS / central UTC
                → Operations dashboard (optional)
Latency budgets matter. Survey-grade overnight batch processing is perfect for timing plans; live adaptive needs stream processing near the junction or a fast backhaul. RD Analytics’ architecture supports file/batch today and real-time-oriented deployments where licensed—pair edge workers with controllers for low-latency sites (edge vs cloud).
Lessons from published adaptive camera projects
Vendor case studies in Europe repeatedly highlight:
- Hours-to-days to instrument a junction when cameras already exist
- Local processing to avoid shipping video to a distant cloud
- Measurable improvements in delay or stops when demand-responsive logic replaces fixed plans
- Integration via open protocols (HTTP/UDP-style event feeds) into existing traffic systems
Treat those as existence proofs for the category. Your ROI still depends on controller vendor APIs, detector health, and political willingness to retune.
Mapping RD Analytics outputs to signal logic
| RD capability | Adaptive use |
|---|---|
| Counting lines by approach | Demand estimation / phase split hints |
| Density / occupancy zones | Queue length proxies; spillback alarms |
| Class filters | Bus or tram priority logic |
| Speed segment collapse | Congestion onset detection |
| Data API / exports | Central UTC, data lake, Fusion |
| Event lists | Offline forensic tuning of plans |
Start with advisory mode: analytics recommends splits; engineers approve. Move to closed-loop only after false-alarm rates are acceptable—city ops blogs emphasise trust over raw model scores.
Pilot plan (one corridor, 90 days)
- Select a signalised junction with chronic off-peak waste or peak spillback.
- Validate camera views (placement guide).
- Configure RD scans: approach lines + occupancy zones.
- Benchmark two weeks of fixed-time performance (travel time, queue cameras, bus OTP).
- Integrate metrics into the controller or an adaptive middleware (partner SI).
- Run adaptive with tight fallbacks to fixed plans.
- Compare the next two weeks; publish a one-page result for elected officials.
Risks and mitigations
| Risk | Mitigation |
|---|---|
| Detection drop at night | Lighting/WDR; night-specific confidence; loop fallback |
| Overreaction to noise | Smooth occupancy; minimum green constraints |
| Cyber exposure | On-prem analytics; segmented networks |
| Vendor lock-in | Prefer open metric APIs over proprietary video |
| Privacy concerns | Metrics to controller, not video (privacy) |
Survey first, adapt second
Many agencies should sequence:
- Video surveys to rebuild timing plans (cheap, high ROI).
- Continuous video detectors on the worst junctions.
- Full adaptive corridor once ops trust the data.
RD Analytics covers step 1 immediately and supports step 2–3 as stream and integration capabilities are enabled for your licence.
Skipping straight to closed-loop adaptive on unvalidated cameras is how cities breed “AI doesn’t work” folklore. Shadow mode—video metrics beside existing loops for a month—is the professional on-ramp.
Controller and SI reality check
Adaptive success is usually 30% analytics, 70% integration:
- Does the controller accept external occupancy or call phases via a supported protocol?
- Who owns fallback timing if the analytics host reboots?
- Are bus operators aligned on priority rules that class filters will trigger?
Bring your signal vendor or SI into the PoC early. Road Data Systems partners on the vision layer; intersection OEMs still own cabinet logic (partners).
What “good” looks like after six months
- Documented reduction in corridor delay or stops in the peak of interest
- No increase in red-light dilemma complaints attributable to erratic splits
- Ops staff using analytics tiles weekly without a data scientist on call
- A written rollback to fixed plans that has been tested once on purpose
If those four are green, expand to the next junction. If not, fix detection and trust before buying more licences.
Next step
If you already run adaptive on loops, pick one camera-equipped site and shadow-compare video occupancy to loop occupancy for two weeks. If you have no adaptive yet, use RD Analytics to rebuild plans from multimodal peaks before buying a controller upgrade.
Discuss adaptive architectures with Road Data Systems · Related: IoT integration, speed/incidents.