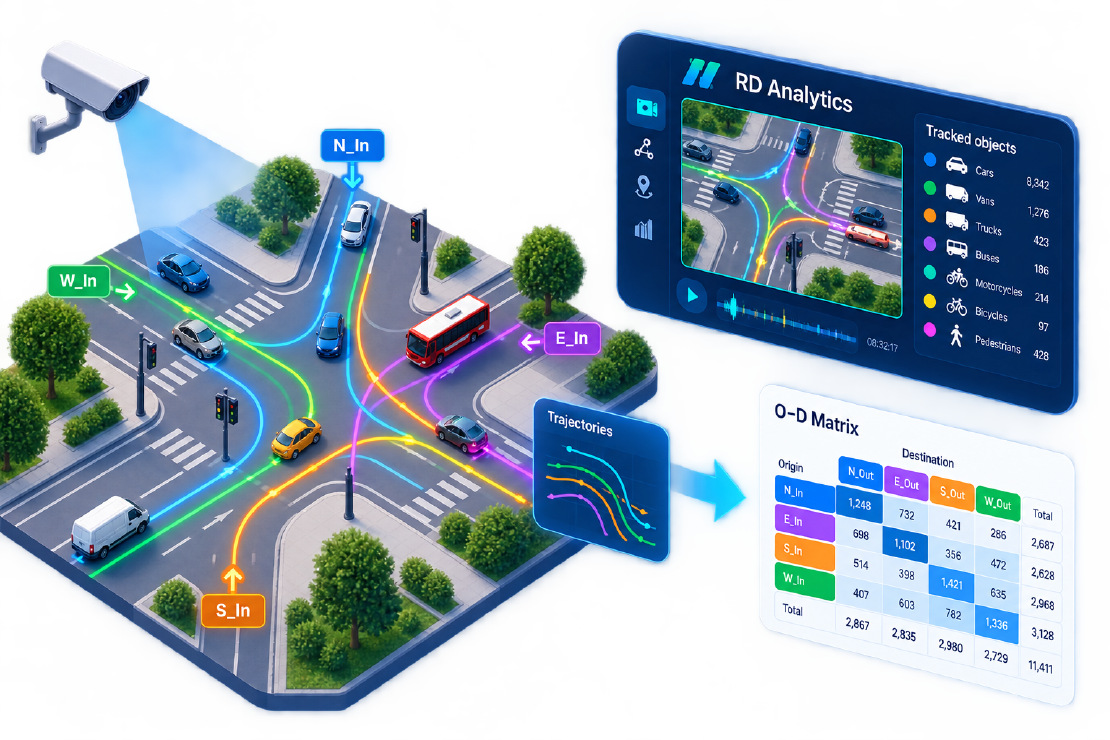
Origin–destination (O–D) matrices sit under almost every serious transport model. They say where movements enter a study area, where they leave, and how demand splits across routes. Get the matrix wrong and microsimulation, strategic models, and impact assessments inherit that error from day one.
Traditionally, observed O–D meant roadside intercepts: stop a sample of drivers, ask origin and destination, expand a thin sample to “all day.” Other video-analytics vendors have made the same point for years—the 2-hour intercept is a snapshot sold as a full picture. Video analytics offers a different path: full trajectories through the observed zone, not a questionnaire sample.
This article explains how origin–destination matrix video analytics works, how traffic flow analysis AI reconstructs routes from line crossings, and how RD Analytics supports that workflow from fixed cameras and drones.
Why intercept O–D surveys hit a ceiling
A typical intercept captures a small fraction of vehicles—often single-digit to low teens percent—then expands the rest with growth factors and judgment. Problems stack:
- Time bias — AM peak behaviour is not inter-peak or Saturday behaviour.
- Non-response bias — through traffic, commercial drivers, and language barriers skew who stops.
- No replay — if expansion assumptions are challenged, you cannot re-interview yesterday’s traffic.
- Logistics — permits, traffic management, weather, and crew gaps; resurveys are rare.
- Cost — multi-site programmes burn budget before a single model run.
Intercepts still have a niche when O–D is secondary and sample error is acceptable. When the matrix drives the model—corridor studies, development TIAs, network planning—sample expansion is a structural risk, not a footnote.
What video gives you instead
From continuous video you can track each object and record the sequence of gates it crosses. That sequence is an observed path through the study area:
South_In → East_Out → one O–D cellWest_In → West_Out → U-turn / recirculation cell
Unlike an intercept answer (“I came from the retail park”), a trajectory O–D is limited to the camera’s geographic scope—but within that scope it is complete for the filmed period, not expanded from a handful of interviews. You can slice the same tracks into AM, PM, or custom model periods without another field day.
Drone bird’s-eye footage is especially strong for complex junctions and roundabouts: one frame can see all legs, so entry–exit pairs are visible without stitching four ground cameras (though multi-camera merge remains an option when drones are not allowed).
How O–D logic maps onto RD Analytics
RD Analytics stores rich crossing and track detail—timestamps, class, line names, directions, and trajectories—then lets you compose reports and exports. Building an O–D-style matrix is a geometry and naming discipline:
1. Name lines as origins and destinations
Treat inbound approach lines as origins and outbound exit lines as destinations. Consistent naming (N_In, N_Out, E_In, …) makes pivot tables and client matrices trivial.
2. Use direction on each line
Forward/backward settings reduce false cells from jitter or wrong-way shadows.
3. Prefer paths that fully traverse the junction
QA should drop tracks that appear mid-scene (camera wake-up) or disappear without an exit (occlusion). Track exports and line-crossing event lists support that cleanup.
4. Merge when one camera cannot see all legs
Large intersections often use one camera per approach. RD Analytics merging combines completed scans so a single report can describe movements across the whole site—an answer to the “fragmented per-camera spreadsheet” problem.
5. Classify before you pivot
O–D cells by vehicle class (car vs HGV vs bus) matter for freight and public-transport modelling. Enable class modules and map class groups to the scheme your model expects.
Worked example: four-leg junction
Brief: classified turning / O–D matrix for a signalised crossroads, 07:00–19:00.
- Mount one high camera with all four exits visible—or four approach cameras plus merge.
- Create a location and upload the day’s files (or batch).
- Draw eight lines (in/out per leg) or four inbound + four outbound with clear names.
- Process the scan; confirm crossings on the timeline for a busy 15 minutes.
- In reports, use quantity / event queries filtered by first line and last line (entry→exit).
- Export CSV/Excel; pivot
line_first × line_lastby class and hour. - Feed the matrix into your modelling toolchain; keep event exports for audit.
For bird’s-eye drone surveys of the same junction, the geometry is often simpler: one orbit or hover, full trajectories, same pivot logic—without intercepts.
Accuracy, scope, and honesty
Video O–D is powerful inside the observed footprint. It does not magically know a driver’s home postcode beyond the cameras. Be explicit with clients:
| Claim | Honest framing |
|---|---|
| “Full O–D” | Full observed paths through the filmed area for the filmed period |
| “Replaces intercepts” | Replaces intercepts for junction/corridor path matrices; household/long-distance O–D still needs other sources |
| “All day” | All day if you recorded all day |
| “Ground truth” | High completeness vs intercepts; still validate against manual samples on a busy hour |
That honesty builds trust—and matches how other video-analytics vendors frame trajectory O–D: complete within the view, not omniscient.
Traffic flow analysis AI beyond the matrix
The same tracks that fill O–D cells also yield:
- Turning movement counts without a separate TMC survey
- Travel-time distributions between gates
- Recirculation / U-turn rates
- Class-specific route preference (e.g. HGVs avoiding a tight left)
One capture, many model inputs—the recurring theme in modern traffic flow analysis AI.
Getting started
If you already run line counts in RD Analytics, you are halfway to O–D: rename lines as in/out pairs, export crossings, and pivot. If you are new, start with a single junction clip, prove entry→exit cells against a manual 15-minute sample, then scale to full-day batches or multi-camera merge.
Next step: Explore RD Analytics with a junction or drone clip and ask for an O–D-oriented report layout. Pair this article with our guides on smart video counting and drone best practices.