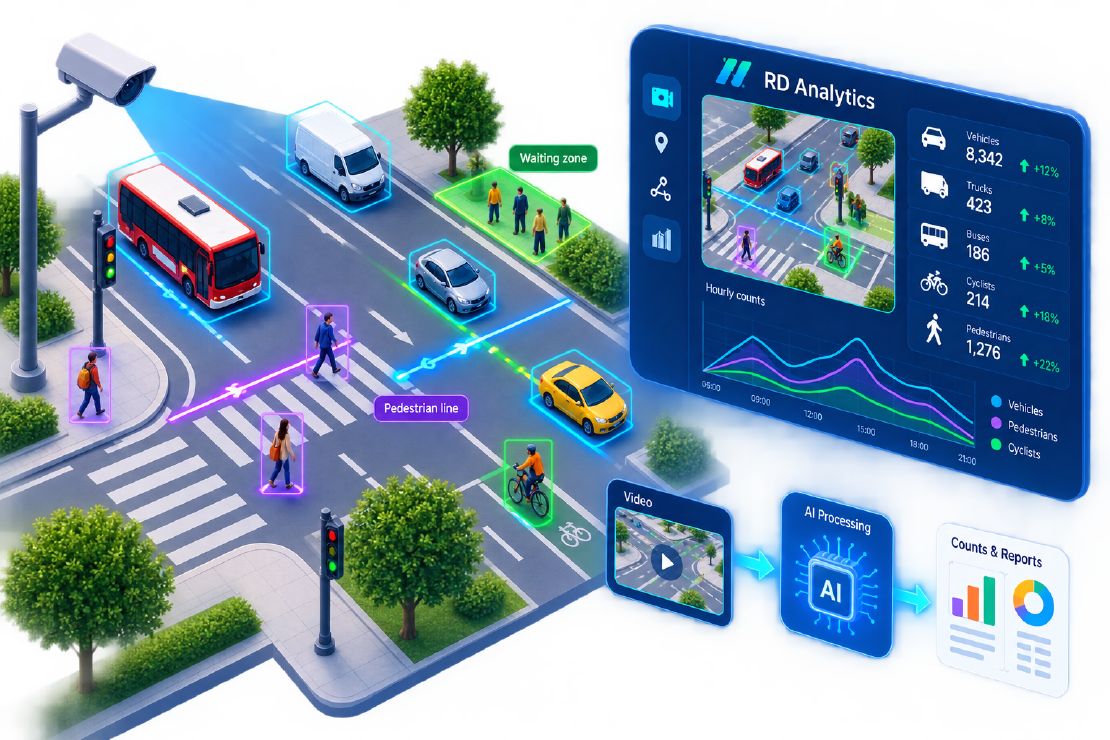
Vehicle counting software used to mean tubes in the road or a person with a clicker. Pedestrian counting AI used to mean a separate study, a different crew, and a second spreadsheet. Modern video analytics collapses those jobs: one camera view, one processing run, and a report that covers cars, trucks, bikes, and people walking in the same time window.
This guide explains how virtual lines and zones turn ordinary footage into multimodal counts—and how RD Analytics implements that workflow for survey teams and city engineers.
Why count people and vehicles together
Complete-street redesigns, shared spaces, school-zone safety, and signal timing all fail when you only know motor traffic. A junction that “works” for cars can still strand pedestrians on long crossings or force cyclists into conflict paths. Agencies that buy two surveys—one for vehicles, one for people—pay twice and still struggle to align timestamps.
Smart video solves the alignment problem at the source. Detectors see road users in the frame; trackers follow them; counting logic fires when a trajectory crosses a line or enters a zone. Pedestrian counting AI is not a bolt-on report—it is the same pipeline with class filters and geometry aimed at footways as well as carriageways.
Competitor blogs in this space often stress multimodal accuracy and camera reuse. The practical lesson for buyers is simpler: if pedestrians matter to the decision, they must be in the same dataset as vehicles.
The two building blocks: lines and zones
Almost every video traffic study is built from two geometry primitives.
Counting lines
A counting line is a virtual gate drawn on the video frame. When a tracked object crosses it, the system records an event: timestamp, class, direction, and line name. Use lines for:
- Approach volumes
- Turning movements (entry line → exit line)
- Directional filters (inbound only, outbound only, or both)
- QA samples (export line-crossing events and spot-check a busy minute)
In RD Analytics you draw lines in the scan geometry editor while paused on a representative frame. Name lines clearly (North_Approach, Ped_Crossing_A) so reports and exports stay readable for clients.
Zones (areas)
A zone (active area, density area, or occupancy region) measures presence inside a polygon rather than a crossing. Typical uses:
- Queue length / occupancy on a stop line
- Pedestrian waiting areas on a footway island
- Parking or kerbside dwell proxies
- Blind / exclusion areas so detections outside the study ROI do not pollute counts
Density sampling can average occupancy over 30 seconds, 1 minute, or 5 minutes—useful when a raw frame-by-frame presence chart is too noisy for a client pack.
A practical setup in RD Analytics
The product workflow matches how survey projects are already organised:
- Location — the physical site (junction, corridor, plaza).
- Source — video file or batch of clips for that site.
- Scan — AI modules + geometry + processing.
- Report — widgets filtered by line, class, and time range.
Modules that matter for multimodal counts
- Vehicle detection — finds common road users (including person and bicycle classes on the detector vocabulary).
- Vehicle classes — richer splits (pickup, van, bus/truck variants, special plant, and more) when the brief needs 12+ class depth.
- Tracker — keeps identities stable so one person or car is not counted three times as boxes flicker.
- Class groups (System admin) — map raw detector names to the labels your agency uses (“LGV”, “Class 3”, “Pedestrian”).
Optional modules such as license-plate recognition or make/model sit beside counting; they are not required for a solid volume study.
Geometry tips that prevent bad counts
| Tip | Why it matters |
|---|---|
| Draw on a busy, representative frame | Lines land on true lanes, not empty asphalt |
| Place vehicle lines where objects are fully visible | Cut-off bumpers at frame edges cause missed/double tracks |
| Use a dedicated ped line on the crosswalk, not the stop line | Separates “vehicles stopping” from “people crossing” |
| Set direction on lines when the brief is one-way | Cuts false reverse crossings from shadows/jitter |
| Exclude sidewalk clutter with blind areas when needed | Reduces spurious person detections outside the study |
| Save the scan as a reusable config | Next week’s batch reuses the same gates |
Run a short test process, scrub the timeline, and only then queue the full file or batch. Supervised review—seeing boxes and crossings frame by frame—is how vehicle counting software earns trust with public clients.
What the report should contain
A multimodal client pack usually needs more than a single total:
- Quantity by line — classic approach volumes
- Quantity by class — cars vs trucks vs people vs bikes
- Line-crossing event lists — for audit and dispute resolution
- Density by zone / by class — occupancy and waiting behaviour
- Charts — 15-minute or hourly profiles for peaks
Export CSV or Excel from the report view after you set scan, time range, and filters. For BI pipelines, the Data API can stream tracks and metrics with class-group and line filters—useful when the survey must land in a city warehouse the same week.
Common failure modes (and fixes)
| Symptom | Likely cause | Fix |
|---|---|---|
| Pedestrians undercounted | Camera too high/far; people < ~20–30 px tall | Lower aim, tighter FOV, or closer temporary camera |
| Double vehicle counts | Line on a weave / stop-line queue | Move line downstream of queues; raise tracking patience |
| Class mix looks “all car” | Only detector classes enabled | Enable vehicle-class module; configure class groups |
| Night counts collapse | Underexposed CCTV | Improve IR/lighting or accept lower confidence with QA |
| Batch files disagree | Different camera aim per hour | One scan per consistent view; do not mix aims |
Video quality still sets the ceiling. AI does not invent pixels that are not there—but it does let you reprocess after fixing geometry, which manual clickers cannot do.
Where this sits in a wider programme
Counting lines and zones are the foundation for later work: origin–destination matrices (entry/exit line pairs), speed segments, drone bird’s-eye surveys, and safety reviews. Get multimodal counting right first. Everything else in traffic video analytics inherits those trajectories.
Next step: Upload a short peak-hour clip to RD Analytics, draw one vehicle line and one pedestrian line, and compare the class split to your last manual sheet. That single experiment usually settles the “do we need pedestrian counting AI in the same tool?” debate.