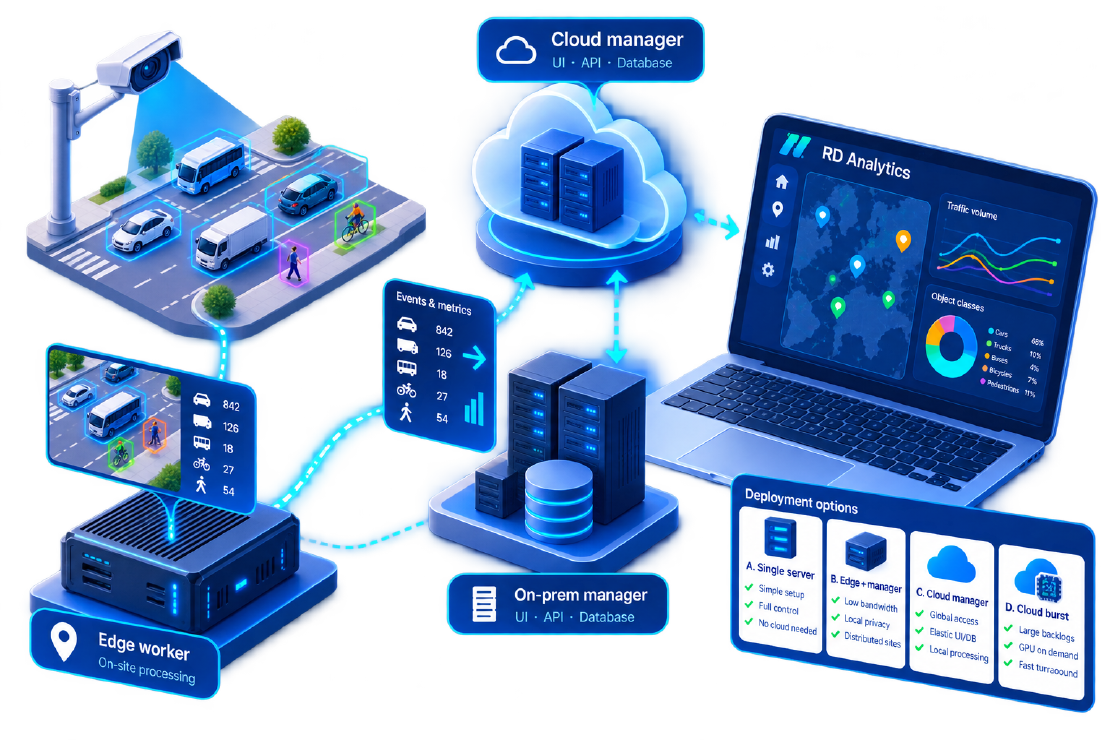
Edge vs cloud traffic analytics is less a religious war than a placement problem: where should GPU recognition run, where should databases and UIs live, and how much video should cross the WAN? RD Analytics is deliberately flexible—on-premise video analytics on a local GPU server today, distributed workers tomorrow, optional cloud-hosted manager for city-scale programmes.
This article compares deployment patterns so IT and transport teams can pick a topology that matches bandwidth, privacy, and ops reality.
The jobs to place
| Job | Description |
|---|---|
| Worker (engine) | Decode video, run neural nets, emit tracks/events |
| Manager (API/UI) | Users, configuration, reports, orchestration |
| Data store | Tracks, metrics, media snapshots, configs |
| Clients | Browsers for engineers and viewers |
On a small survey box, worker and manager share one Linux host. At city scale they split.
Pattern A — Single on-prem server (the default start)
Best for: consultancies, single-city survey labs, DOOH pilots, first municipal PoC.
- Install RD Analytics on one x86_64 Linux machine with NVIDIA GPU
- Upload files or attach local sources; users browse to port 9006
- Data stays on the LAN; no dependency on public cloud for recognition
Pros: simplest ops, strongest data control, predictable cost.
Cons: finite concurrent pipelines; remote sites must ship disks or haul video.
This is classic on-premise video analytics—and where most RD Analytics journeys begin.
Pattern B — Edge workers + central manager (campus / multi-site)
Best for: multiple junctions, remote garages, distributed CCTV without hauling video centrally.
RD’s manager–worker architecture is designed for this:
- Place a recognition worker near the cameras (full GPU server or compact embedded PC, depending on load)
- Keep a central manager in the data centre for UI, reports, and unified views
- Send results, not continuous full-resolution video, to the centre
Pros: low WAN cost, lower privacy exposure, local resilience if the WAN blips.
- Cons: more hosts to patch; need monitoring of edge health.
Other video-analytics vendors often tell “edge to server” stories for the same reason: bandwidth and autonomy. The principle is universal; RD Analytics implements it with manager–worker scale-out.
Pattern C — Cloud manager + on-prem workers
Best for: multi-region programmes that still refuse to stream raw video off-site.
- Host the manager and databases on AWS/Azure/GCP
- Keep GPU workers in local facilities processing cameras/files
- Operators log into the cloud UI from anywhere
Pros: elastic UI/DB, easier multi-tenant admin, central upgrades.
Cons: cloud account governance; still need solid site-to-cloud control channels.
Pattern D — Heavy cloud post-processing (survey burst)
Best for: large drone/file campaigns with spiky demand.
Some other vendors emphasise pure cloud upload-and-analyse for surveys. RD Analytics can process large file/batch workloads on sized GPU hosts you control—including cloud GPU instances acting as temporary workers—without forcing a SaaS-only model. Choose this when capital for GPUs is scarce but project deadlines are not.
Decision table
| Constraint | Prefer |
|---|---|
| Strict data residency / air-gapped leanings | A or B |
| Many remote camera clusters | B |
| Small IT team, one lab | A |
| Nationwide users, local processing | C |
| Huge one-off video backlog | D (burst GPUs) |
| Real-time corridor ops | B (edge) with careful stream design |
| Survey-only, offline disks | A |
Hardware reality check
Typical GPU host guidance for the engine service:
- NVIDIA driver (recent, e.g. ≥ 590 recommended in current docs)
- NVIDIA Container Toolkit for Docker GPU
- ~32 GB RAM recommended on GPU hosts
- Tens of GB disk for media and TensorRT engines
- Linux x86_64
Concurrent scan pipelines are configurable (admin runtime settings; engine restart applies limits). Size GPUs to resolution, module set (detection + classes + extras), and how many files you process at once—not to marketing “camera counts” alone.
Privacy, cost, and failure modes
Privacy: Edge processing keeps identifiable video local; central systems store events and optional snapshots. That story matters in GDPR-sensitive procurements—more than raw accuracy slides. Municipal blog posts in this market repeatedly flag data ownership as a contract killer—decide residency before you pick a logo.
Cost: Cloud GPU hours look cheap until always-on streams multiply. Edge caps cost but needs capex. Hybrid (B/C) is usually the adult answer for cities. For survey-heavy consultancies, Pattern A with occasional burst workers (D) often beats a permanent cloud subscription.
Failure modes:
- WAN down with pure central decode → blind network
- Edge disk full → failed sources
- Undersized GPU → backlog, not “AI inaccuracy”
- Clock skew across workers → broken time ranges in merged reports
Design monitoring for queue depth, disk, and engine health (RD Analytics maintenance views help operators see pipeline load).
Bandwidth back-of-envelope
Shipping 1080p continuous video from twenty sites will dominate WAN cost and politics. Shipping tracks and metrics will not. If a design assumes “all cameras to central GPU,” calculate peak Mbps before procurement—not after. Edge workers exist to make that calculation boring.
Rough intuition (order-of-magnitude only):
- Continuous 1080p stream per camera: several Mbps sustained
- Structured track/metric feed: kilobits to low hundreds of kbps
- Nightly file sync of selected clips for QA: schedulable, not real-time
Choose topology with those ratios in mind.
Recommended path
- Start with Pattern A on a single GPU server; prove one corridor.
- When a second site appears, split a worker (Pattern B) rather than shipping all video home.
- If user access must be global but video must stay local, lift the manager to cloud (Pattern C).
- Integrate metrics via API into the IoT layer (integration guide).
Next step: Match your residency and bandwidth constraints to A–D, then follow the installation guide or contact Road Data Systems for a sized architecture workshop. Product overview: RD Analytics · architecture.