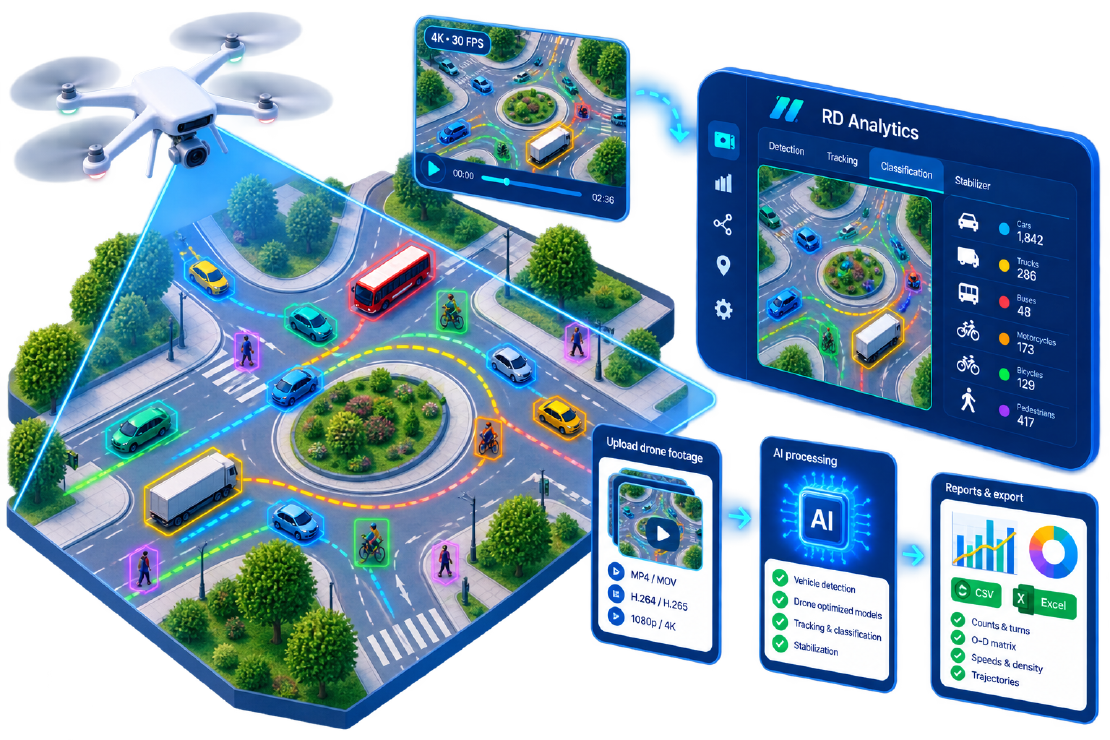
Drone traffic analysis has moved from novelty to standard toolkit. Consultancies use UAV traffic analytics for roundabouts that defeat ground cameras, for corridors where poles are scarce, and for O–D path studies that once needed intercept crews. Other video-analytics vendors tell the same story: a bird’s-eye view sees the whole junction at once.
RD Analytics is built to process that footage: upload drone video, detect and classify road users, extract trajectories, and produce counts, speeds, and origin–destination style tables. This article focuses on how to capture and prepare UAV video so the AI has a fair chance—and how to run it through a typical RD Analytics workflow.
When drones beat ground cameras
| Situation | Why UAV helps |
|---|---|
| Large roundabouts / gyratories | One frame sees all entries and exits |
| Complex weaving sections | Trajectories stay visible without pole occlusion |
| Temporary surveys | No waiting for CCTV IT access |
| O–D / path studies | Full in-view routes without multi-camera stitch |
| Before/after scheme reviews | Repeatable hover points if flight plans are saved |
Drones are weaker for long tunnels, dense tree canopy, strict no-fly urban cores, and multi-hour continuous monitoring (battery and regulatory limits). Hybrid programmes—drone for geometry-heavy peaks, fixed cameras for overnight—are common.
Flight planning that protects data quality
Height and ground sample distance
Fly high enough for safety and permissions, low enough that small road users remain detectable. As a rule of thumb for analytics (not a legal limit):
- Vehicles: aim for cars that span tens of pixels in width at mid-scene.
- Pedestrians / cyclists: need more resolution or a lower pass; otherwise accept vehicle-only deliverables.
If the brief includes people walking, say so before the pilot flies “highway height.”
Angle and orientation
Nadir (straight down) or near-nadir simplifies trajectory geometry and O–D. Oblique cinema shots look impressive and often wreck tracking. Keep the optical axis stable; avoid orbiting so fast that objects smear.
Duration and batteries
Traffic peaks are not optional. Plan battery swaps or dual aircraft so AM peak is continuous. Avoid gaps in the flight log; analysts hate silent minutes in the middle of 08:00–09:00.
Wind, rain, and glare
Light wind is fine; heavy buffet breaks stabilisation and tracking. Rain and wet pavement glare hurt classification. Midday hard shadows can split vehicles—morning/afternoon soft light is kinder. RD Analytics includes stabilizer geometry for residual shake, but it is not a substitute for a calm airframe.
Legal and operational checklist
- Local aviation rules, NOTAMs, and city permissions
- Privacy / signage where required
- Pilot licensing and insurance
- Safe take-off / contingency ditch zones away from live lanes
- Agree with the client what will be retained (raw 4K vs processed data only)
Capture settings that help the models
| Setting | Guidance |
|---|---|
| Resolution | Prefer 1080p or higher; 4K helps peds if bitrate is solid |
| Frame rate | 25–30 fps typical; avoid ultra-slow cinematic fps for counting |
| Bitrate / codec | High bitrate H.264/H.265; avoid heavy compression “travel” presets |
| Electronic zoom | Avoid; move closer or change lens instead |
| Onboard stabilisation | On; still plan for software stabilizer if needed |
| File splitting | One-hour files are fine; keep naming chronological |
Copy files to the RD Analytics server (upload via UI or bulk copy for large volumes). Use a batch of videos source when the peak is split across clips.
Processing drone video in RD Analytics
- Create a Location for the site.
- Add a Source and upload/attach the UAV files.
- Create a Scan; enable vehicle detection—use the vehicle drone detector path when the deployment includes bird’s-eye models (drone-oriented models are trained for overhead views).
- In the geometry editor, draw counting lines on entries/exits, density zones if needed, and speed segments only if you can measure real-world distances reliably from the ortho view.
- Add a stabilizer region if residual shake remains.
- Process to completion; review the timeline on a busy minute.
- Build reports: quantity by line/class, O–D style first→last line pivots, optional speed charts.
- Export CSV/Excel; use merge if multiple flights or cameras must combine.
RD Analytics recognises pedestrians, motorcycles, cars, vans, trucks, and buses from bird’s-eye views when models and resolution allow—match class groups to the client scheme after processing.
Best practices specific to UAV traffic analytics
Mark control distances on the ground if you need metric speeds or calibrated lengths—painted marks or known kerb distances make speed-line calibration defensible.
Keep one scan per consistent altitude/aim. Mixing an 80 m hover and a 120 m pass in one geometry confuses scale.
QA against a manual sample. Count one 10-minute window by eye or clicker; compare to line totals before delivering the full-day matrix.
Mind privacy. Overhead video can show yards and faces. Define retention, access roles (RD Analytics zones/users), and whether exports include snapshots.
Do not oversell continuity. A 20-minute flight is not a 24-hour ATR. State the observation window in the method statement.
Common mistakes
| Mistake | Result |
|---|---|
| Cinematic orbit | Broken tracks, junk O–D |
| Too high for peds | “Vehicle-only” surprise at delivery |
| Heavy compression | Missed small objects |
| Unnamed lines | Unusable matrix pivots |
| No peak coverage | Beautiful off-peak data, wrong decision |
| Skipping stabilizer on windy days | Wobbly counts |
Where drones fit the RD Analytics roadmap
UAV surveys are often the on-ramp: prove value on one roundabout, then expand to fixed CCTV programmes, multi-server processing, and API feeds into city systems. The software path is the same—location → source → scan → report—whether the lens is on a pole or under a drone.
Next step: Plan a short peak flight with nadir hover, then process it in RD Analytics. Pair with our O–D from video guide when the deliverable is a matrix, not only volumes.