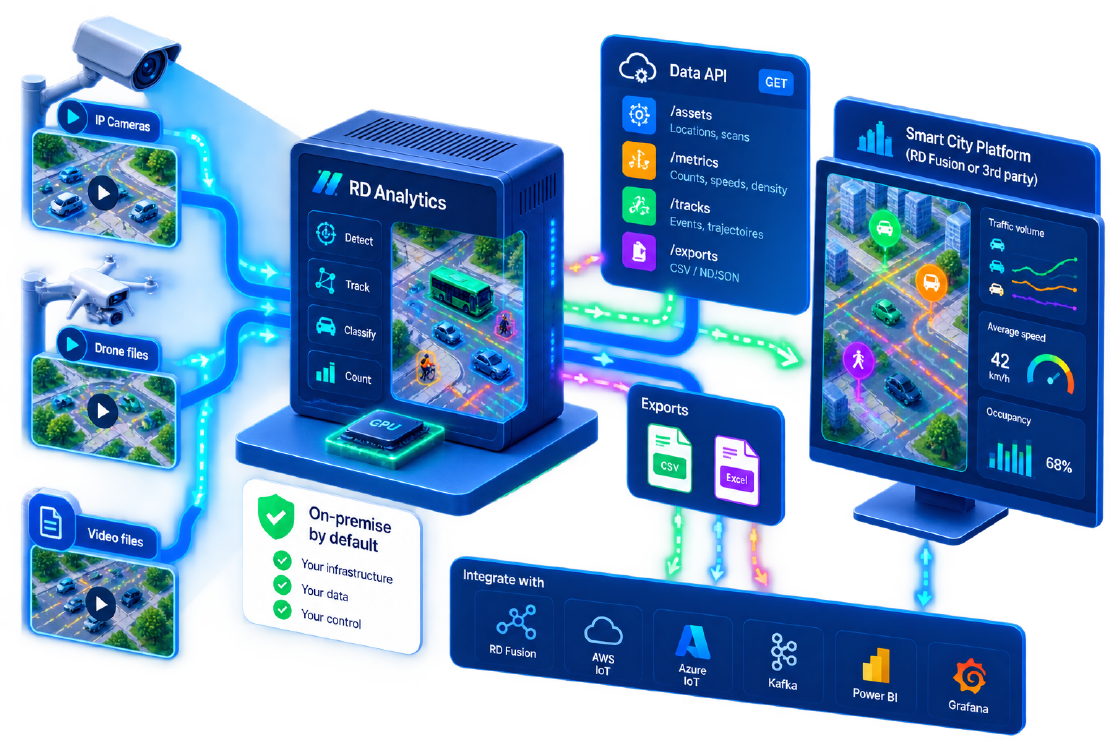
Smart city programmes collect data from signals, loops, weather stations, parking sensors, and CCTV. The missing piece is often traffic analytics IoT integration: turning camera pixels into structured events that other systems can consume. Without that bridge, video stays in a surveillance silo while dashboards show yesterday’s counts.
This article explains how RD Analytics acts as a traffic sensor layer for smart city traffic AI platforms—especially alongside Road Data Systems’ broader stack such as RD Fusion—using exports and the Data API.
What “integration” means in practice
City architects usually need three outcomes:
- Authoritative traffic measures — volumes, classes, speeds, occupancy—not only video walls.
- Machine-readable delivery — APIs or files into BI, OT systems, and data lakes.
- Governance — zone-scoped access, on-prem processing, clear ownership of data.
Municipal buyers and other video-analytics vendors stress the same procurement filters: work with existing cameras, produce actionable structured data, and clarify who owns the data. RD Analytics is aligned with that checklist: camera-agnostic file/stream inputs, browser ops, and API read access for ETL.
Reference pattern
Cameras / drone files
        │
        ▼
 RD Analytics (detect → track → classify → count)
        │
        ├── Interactive reports (engineers, consultants)
        ├── CSV / Excel / track exports (project delivery)
        └── Data API (ETL → IoT platform / BI / RD Fusion)
Recognition can stay on municipal GPU servers. Only metrics and tracks need to move to the city platform—not continuous raw video—reducing bandwidth and privacy exposure.
What the Data API exposes
RD Analytics provides read-oriented data endpoints (typical base https://<host>:9006/api) for integrators:
| Resource | Role in a smart city stack |
|---|---|
| Assets | Catalogue locations, sources, scans (zone-scoped) |
| Class groups / vocabulary | Stable labels for dashboards |
| Tracks | Per-object events, lines, speed, optional plates |
| Metrics | density.avg / max, speed.avg / count, blind.avg |
| Async exports | Large CSV/NDJSON jobs for data lakes |
Authentication uses API keys (machine-to-machine) or JWT. Keys are zone-scoped so a parking bureau cannot pull an unrelated corridor’s tracks.
Example integrator flow:
- Admin creates an API key bound to the IoT zone.
- ETL lists assets, discovers new completed scans.
- Job pulls metrics for dashboards every 5–15 minutes (or batch nightly for surveys).
- Track exports enrich safety or model calibration warehouses weekly.
See product docs for pagination, cursors, and export job statuses when wiring production ETL.
Pairing with RD Fusion and other IoT platforms
RD Fusion is Road Data Systems’ smart city IoT platform for combining traffic systems, sensors, surveillance, and third-party services. RD Analytics fits as the vision analytics producer:
- Fusion (or any city ESB) schedules pulls or receives pushes from middleware
- Operators see traffic KPIs beside asset and incident layers
- External partners get controlled shares without VPN access to the GPU hosts
The same pattern works with generic stacks: Azure IoT, AWS, on-prem Kafka, or a BI tool (Power BI, Grafana) via scheduled API extract.
Architecture options from the RD Analytics product line—local worker servers, central manager, optional cloud-hosted manager—exist specifically so cities can scale without hauling all video to one SOC.
Design tips for durable integrations
| Tip | Rationale |
|---|---|
| Treat class groups as a contract | Dashboard labels must not drift when models update |
| Prefer metrics for live tiles; tracks for deep analytics | Volume vs cost |
| Version location IDs in the city GIS | Join traffic to assets on one map |
| Separate survey projects from ops feeds | Different SLAs and retention |
Log ETL watermarks (since cursors) | Reliable incremental sync |
| Keep raw video retention short | Privacy boards sleep better |
Example: corridor operations dashboard
A transport operations centre wants a corridor tile: volume, average section speed, and approach occupancy.
- Configure scans with counting lines, speed segments, and density zones.
- Process live or frequent batches (per licence and deployment).
- ETL reads
speed.avg, density metrics, and quantity aggregates via API. - Fusion/dashboard shows sparklines; clicking through opens RD Analytics for evidence (scene overview, events).
Engineers keep the rich UI; operators keep a simple IoT view. That split is what makes smart city traffic AI usable.
Example: planning data lake
A modelling team needs classified turning counts and O–D cells for annual model updates—not a real-time tile.
- Survey scans complete overnight; status becomes
COMPLETED. - ETL watches assets for new scans since the last watermark.
- Async track export lands in the data lake as NDJSON/CSV.
- A dbt/SQL job pivots
line_first × line_lastby class and hour into the model input schema. - QA notebooks sample event lists against a stored reference clip.
Same API, different SLA: nightly batch instead of minute-level metrics. Do not force planning extracts through an operations message bus if a file drop is enough.
Anti-patterns to avoid
- Streaming raw video to the cloud “for AI” when an edge worker could emit tracks locally
- One shared API key for every contractor (no zone scope, no revocation story)
- Renaming class groups weekly and breaking historical dashboards
- Building IoT tiles before a human has validated one junction report
- Assuming plates must flow to the city bus (they usually should not)
Security and privacy posture
- Process on infrastructure you control (LAN or private cloud).
- Scope API keys to zones.
- Export only fields you need (plates are opt-in on track queries).
- Align with local CCTV codes of practice; video analytics does not require publishing imagery to be useful.
Getting started
- Stand up RD Analytics on a GPU host (installation guide).
- Complete one junction report manually.
- Issue an API key; pull
/data/assetsand one scan’s metrics. - Wire a single Grafana/Power BI panel before boiling the ocean.
- Invite the IoT platform owner once the contract of labels and refresh rates is clear.
Talk to Road Data Systems about Analytics + Fusion architectures, or explore RD Analytics and the architecture overview for manager–worker scale-out.