Budgets approve stories with numbers. Traffic analytics ROI is how you turn “we should try AI video” into a line item that survives a finance review. This article shows a practical way to reduce costs of traffic counting programmes while valuing richer data—not only cheaper peaks.
Illustrative figures below are planning templates, not Road Data Systems quotes. Replace with your labour rates and camera inventory.
What to count in the ROI model
Costs (AI video with RD Analytics)
| Item | Notes |
|---|---|
| Software / licence | Per deployment agreement |
| GPU server (capex or cloud GPU) | Shared across many sites |
| Cameras | Often €0 incremental if CCTV exists; else temporary hire |
| Staff setup & QA | Hours per site, declining with templates |
| Storage / retention | Policy-driven |
| Training | One-time for the team |
Benefits
| Benefit | How to monetise |
|---|---|
| Avoided manual labour | Counters × hours × rate × sites |
| Avoided remobilisation | Brief changes → reprocess, not rehire |
| Avoided second surveys | Peds/speeds/O–D from same footage |
| Faster delivery | Fewer liquidated damages / more jobs per FTE |
| Better decisions | Avoided cost of a wrong rebuild; safety scheme targeting (harder £ but real) |
| Re-use | Same server for DOOH, parking, ops feeds |
Competitor blogs often cite large percentage savings versus manual programmes; your finance team will care more about your rate card and site list.
Worked example A — Consultancy survey season
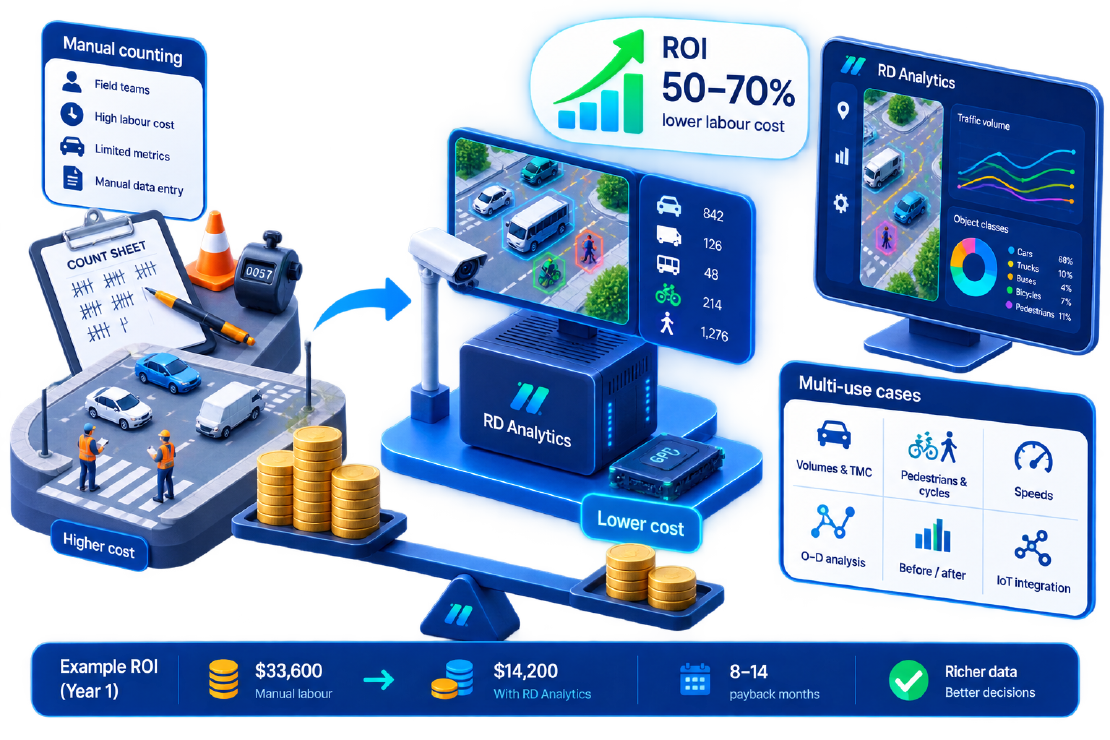
Before: 30 junctions × 4 approaches × 8 peak hours × $35/h fully loaded labour ≈ $33,600 labour alone (plus travel, weather redo, data entry).
After (video):
- Existing CCTV or 30 temporary camera-days
- 2 engineers × 3 days setup/templates + 0.5 day QA per site equivalent
- Shared RD Analytics GPU server amortised over the season
Even with conservative QA time, labour often drops by half or more once templates exist—while delivering class splits and replay QA that manual sheets lacked. Traffic analytics ROI here is mostly labour substitution + higher win rate on tenders that require multimodal data.
Worked example B — City with CCTV already paid for
The camera fleet is sunk cost. Incremental cost is software + GPU + a part-time analyst.
Benefits stack:
- Replace a slice of annual manual count contracts
- Before/after studies without new fieldwork (intersection safety workflow)
- Feed IoT dashboards via API (integration)
Payback frequently lands inside one budget year when three or more use cases share the platform (top 10 use cases).
Worked example C — Avoided civil works
A new loop installation can cost thousands per approach once traffic management and reinstatement are included. A temporary camera + RD Analytics processing for a 2-week diagnostic is often cheaper—and removable. ROI is capex avoided, not only opex.
Soft benefits finance underweights (document them anyway)
- Dispute resolution via timeline replay (fewer change-order fights)
- Safety evidence before crashes accumulate
- Staff not standing in live lanes (H&S)
- Data residency with on-prem processing (procurement risk reduction)
A one-page ROI calculator (copy into your spreadsheet)
Annual manual survey spend (labour + contractors) ........ A
Expected share replaceable by video ..................... r
Avoided spend ........................................... A × r

Incremental AI annual cost (licence + GPU amort + staff) . B
Net Year-1 benefit ...................................... A×r − B
Payback months .......................................... B / ((A×r)/12)

Extra value (second metrics, faster bids) ............... C  (optional)
Run sensitivity at r = 30%, 50%, 70%. If Year-1 is only breakeven at 70%, shrink camera hire assumptions or expand use cases sharing the GPU.
How RD Analytics specifically protects ROI
- Reuse geometry — before/after without remobilising
- Batch + concurrent pipelines — more hours of video per week per engineer
- Class groups — one process, many client label schemes
- Export/API — value beyond a PDF
- On-prem — no per-minute cloud surprise bills for huge archives
Accuracy still matters: bad camera setup destroys ROI through rework (camera guidelines).
Pilot design that proves ROI in 60 days
- Pick 3–5 sites you already count manually.
- Process the same peaks in RD Analytics.
- Compare labour hours, delivery time, and audit outcomes.
- Present the one-page calculator with your numbers.
- Only then scale licences and servers.
Next step
Bring last year’s survey invoices and a CCTV list to a working session. Road Data Systems can help map which line items video can retire first—so “reduce costs of traffic counting” becomes a schedule, not a slogan.
Related: AI vs loops, manual vs AI.