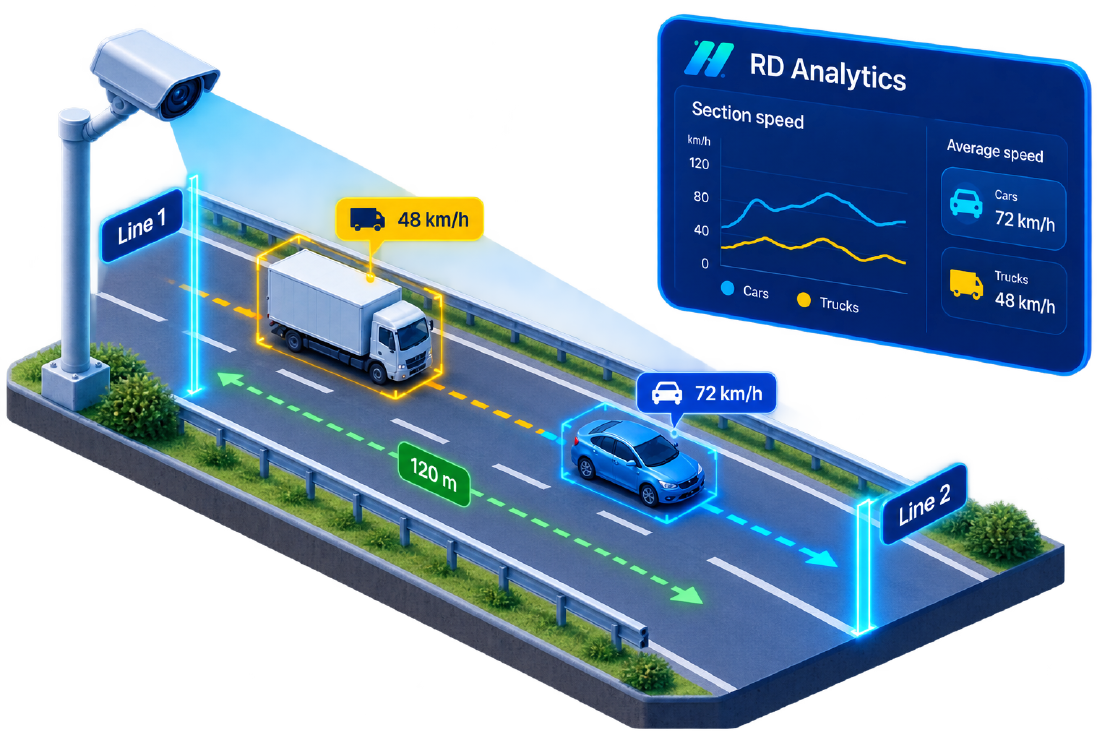
Volume alone rarely explains why a corridor fails. Speeds collapse in a bottleneck, queues form on one approach, and “incidents” are discovered when a radio call arrives twenty minutes late. Speed detection video analytics and AI-assisted incident awareness close that gap: the same cameras used for counts can measure how fast traffic moves—and highlight when behaviour breaks the pattern.
This article covers how RD Analytics measures section speeds from video, how overspeed and abnormal flow show up in reports, and how teams should (and should not) talk about AI traffic incident detection in survey and operations contexts.
Why speed belongs next to volume
A site can show acceptable hourly volumes and still be unsafe or unreliable:
- High mean speed with poor compliance near a school gate
- Sudden speed drop that marks the onset of spillback
- Wide speed variance that signals stop–go shockwaves
- Class-specific behaviour (cars free-flowing while HGVs crawl)
Traditional speed guns and tubes sample a point. Video section speeds measure travel between two gates on the same scene—closer to how drivers experience a link—and retain class and time context for every sample.
Industry writing on late incident detection stresses the cost of minutes lost before a TOC reacts. Even when you are not running a live control room, post-event speed and trajectory data still explain what happened in a safety or capacity study.
How video speed measurement works
In RD Analytics, speed measurement geometry uses two lines plus a real-world distance:
- Draw Line 1 and Line 2 across the carriageway (or lane group).
- Enter the distance between lines in metres (surveyed or taken from a scaled plan / known markings).
- Choose a speed bin (for example 5, 10, or 20 km/h) for histograms.
- Process the scan; the pipeline times trajectories between the gates and converts to km/h.
Perspective is handled in the recognition stack when the scene is configured correctly—object scale should stay consistent whether a vehicle is near or far. Always validate with a known-distance check and a sample of vehicles against a radar gun or floating car if the deliverable is contractual.
Report outputs that matter
| Output | Use |
|---|---|
| Average section speed | Time series for the link; before/after schemes |
| Speed bins / histograms | Compliance and design-speed discussions |
| Per-track speed (exports) | Outliers, overspeed lists, class splits |
| Quantity + speed together | Diagnose whether “slow” is volume or friction |
Overspeed and “incident-like” signals from survey video
RD Analytics is strongest today as a survey and analytics platform: file/batch processing, rich tracks, reports, and API export. Within that scope you can already support many safety and operations questions:
- Overspeed lists — filter tracks above a threshold for a posted limit study
- Sudden speed collapse — compare 5-minute average speed to a baseline period
- Stop–go detection proxies — high variance in section speed over short intervals
- Queue onset — combine speed drop with density/occupancy zones on the approach
- Conflict context — pair slow/erratic segments with pedestrian crossing counts (see multimodal counting)
Be precise in proposals: continuous sub-second TOC alerting is a different product posture than analysing recorded video for speed and abnormal events. RD’s architecture supports growth toward live streams where licensed; many city programmes still start with recorded peaks and expand.
Field checklist for trustworthy speeds
| Step | Detail |
|---|---|
| Pick a straight, visible segment | Weaves and hidden bends break timing |
| Measure distance properly | Wheel, laser, or CAD—not a guess from pixels alone |
| Avoid stop-line placement | Queues make “speed” mean “delay” |
| Separate lanes if needed | Dual carriageways may need dual segments |
| Match class filters | Motorcycle vs HGV free-flow differ |
| Night QA | Headlights and glare; confirm detector confidence |
| Document method | Distance source, bin size, exclusions |
Worked mini-brief: school-zone compliance
Question: Are cars respecting 30 km/h on the approach between 07:30 and 09:00?
- Mount or reuse a camera covering ~40–60 m of approach.
- Place two speed lines 40 m apart on the clear section before the crossing.
- Process AM peak files in RD Analytics.
- Export speeds; share % of tracks above 30 and 40 km/h by 15-minute bin.
- Overlay pedestrian crossing counts from a parallel counting line for the same window.
The deliverable is not only a mean speed—it is a compliance profile tied to when children are present.
Connecting speed data to wider systems
Via CSV/Excel or the Data API (speed.avg, speed.count, track exports), speed series can feed:
- Congestion dashboards
- Before/after scheme evaluation
- Model calibration (free-flow and congested speeds)
- RD Fusion / smart-city IoT platforms as another sensor stream
That integration path is the bridge from a one-off speed survey to ongoing network intelligence.
Limitations to state up front
- Poor calibration distance → biased km/h
- Heavy occlusion → missing samples, not “zero speed”
- Camera shake (drone) → use stabilizer; prefer fixed mounts for contractual speed work
- Legal enforcement → analytics for engineering studies ≠ certified enforcement device unless separately approved
Next steps
If you already count with lines, add a speed segment on one clean link and compare average section speed through the peak. For live operations ambitions, discuss camera layout and deployment topology (edge vs central) with Road Data Systems.
Explore speed and section analytics in RD Analytics. Related reading: counting with lines and zones, edge vs cloud deployment.