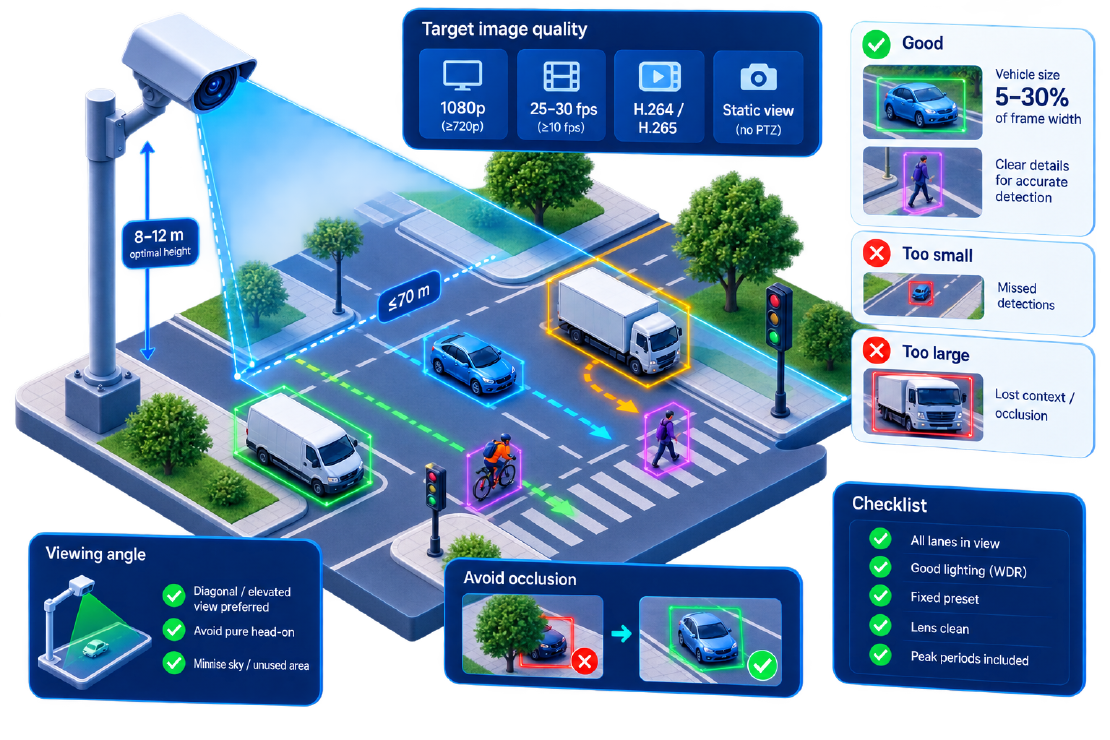
The fastest way to blame “the AI” for bad counts is to feed it bad video. Traffic camera placement and encoding choices decide whether RD Analytics (or any video analytics engine) can see vehicles and people clearly. This guide consolidates practical video analytics camera guidelines used across the industry—adapted for RD Analytics survey and ops work.
Rule zero: if you cannot clearly identify the object with your own eyes in a paused frame, do not expect reliable detection.
Target image quality
| Parameter | Practical target | Notes |
|---|---|---|
| Resolution | 1920×1080 preferred; ≥1280×720 OK | 640×480 is a hard floor and often too weak for peds |
| Frame rate | 25–30 fps | ≥10 fps minimum; low fps breaks tracking in dense flow |
| Codec | H.264 / H.265 | Avoid heavy “overnight low bitrate” presets |
| Viewport | Static | No touring, no stream switching mid-study |
| Object size | Roughly 5–30% of frame width for vehicles | Too small → misses; too large → lost context / occlusion |
4K helps when the camera is high or the brief includes small objects (pedestrians, scooters). It also costs disk and GPU—match resolution to the hardest class you must count.
Height and distance
Industry guidance that works well for junction cameras:
| Recommendation | |
|---|---|
| Optimal height | ~8–12 m |
| Minimum height | ~5 m (lower → foreground blockers) |
| Maximum for multimodal | ~30 m before peds/cycles suffer |
| Distance | Keep critical objects within ~70 m for full class mix when possible |
Lower poles looking under trees fail; roof mounts that are too high turn people into dots. For vehicle-only highway views you can fly higher (especially with drones)—accept that pedestrians drop out (drone guide).
Angle and FOV
- Diagonal or elevated side views usually beat flat head-on for classification.
- Pure head-on can hide axles and length (painful for fine truck schemes).
- Nadir drone views excel for O–D; stabilise or use RD’s stabilizer geometry if the airframe shakes.
- Avoid extreme fisheye barrel distortion when possible.
- Cover the lanes you care about; do not waste pixels on sky and car park if the brief is the junction.
Obstacles and occlusion
| Obstacle | Effect | Mitigation |
|---|---|---|
| Trees, banners, signals | Broken tracks, double counts | Move mount; crop/blind areas |
| Queues stacking | Missed rear vehicles | Place count lines downstream of stop line |
| Night headlights / glare | Washed detections | WDR cameras; aim off direct sun paths |
| Dirty dome | Permanent soft focus | Maintenance schedule |
| PTZ tours | Inconsistent geometry | Lock preset for analytics |
Large occluders are worse than thin poles. If a bus hides a bike every cycle, no model fully heals that.
Lighting, shutter, and night
- Objects must be illuminated enough for a human to see contours.
- Disable overly long night shutters that smear cars into streaks.
- Prefer cameras with WDR for mixed shadow/sun.
- IR-only scenes can work for vehicles; test before promising ped accuracy.
- Do not switch day/night profiles in a way that changes FOV or crop mid-study.
Encoding and file hygiene for RD Analytics
RD Analytics ingests video files and batches (and stream workflows where licensed). For file surveys:
- One continuous setting per source—no resolution flips mid-file.
- Split long days into hourly files if needed; use batch sources.
- Name files with site + start time.
- Copy large volumes by disk to
/opt/rd_analyticsdata paths when uploads are slow. - After upload, draw geometry on a busy representative frame, not an empty midnight frame.
Checklist before you press record
- Height/aim cover all study lanes
- Sample frame shows cars clearly; peds if required
- 1080p @ 25–30 fps (or justified exception)
- Fixed view; PTZ locked
- Lens clean; sun flare minimised
- Peak periods included
- Privacy/signage handled (privacy article)
- Plan for RD scan geometry (lines/zones/speed)
Quick validation in software
After a short test process in RD Analytics:
- Scrub the timeline—boxes should stick to objects.
- Compare a 10-minute manual count on one line.
- If peds are missing, lower aim or tighten FOV before buying a “better model.”
- Save the scan as a template for the next day.
Next step
Audit one existing CCTV preset against this list before the next survey season. Many “AI failures” disappear after a 2-metre mount change or a bitrate increase. Then process a sample in RD Analytics.
Related: installation, counting, drones.