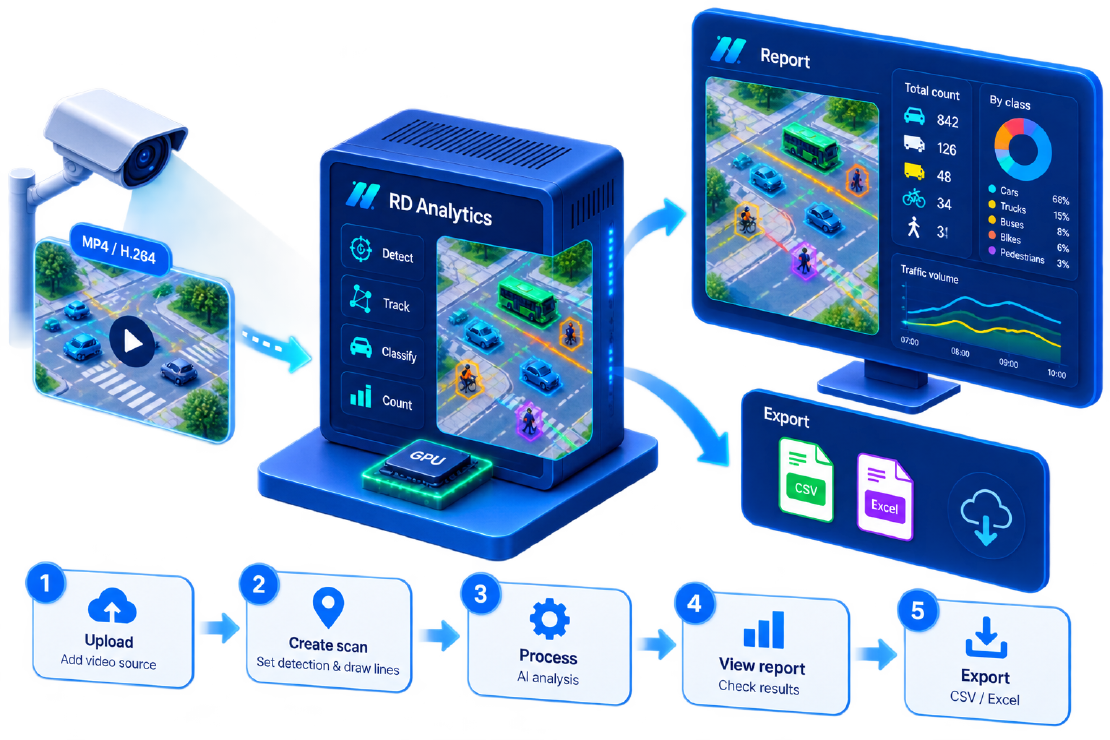
New users ask the same questions in the first week. This traffic analytics FAQ and short RD Analytics tutorial consolidate answers from product docs, hardware reality, and common industry camera Q&As (including publicly documented ranges such as 640×480 @ ~10 fps as a bare minimum elsewhere in the market—usable only with caveats).
Product hub: RD Analytics.
Part A — Tutorial: your first report in one sitting
Goal: From login to exported counts on a sample junction clip.
Prerequisites
- Running RD Analytics instance (see installation guide)
- Engineer or admin role
- A short MP4/H.264 clip where vehicles are clearly visible
Steps
- Sign in at
http://<server>:9006. - Locations → Add — name it
Tutorial Junction. - Sources → Add — attach to that location; upload the clip on the Files tab; wait until ready.
- Scans → Add — open the scan; enable vehicle detection (and classes if licensed); leave tracker on.
- Draw settings — pause on a busy frame; draw one counting line across an approach; name it
North_In. Optional: a second line for exits. - Set status to process and start; wait until COMPLETED.
- Reports → Add — link the scan; open view; set time range; Apply.
- Add widgets: quantity by line, quantity by class; optional scene overview.
- Actions → Export → CSV or Excel.
You now have a defensible mini-deliverable. Next: class groups, speed lines, O–D naming, batches, and API keys—see Counting Vehicles & Pedestrians with Smart Video, Building Origin–Destination Matrices from Video, Measuring Traffic Speed & Incidents with AI, Integrating RD Analytics with Smart City IoT, and Custom Vehicle Classes: From E-Scooters to EVs.
Part B — FAQ
Product and licensing
What is RD Analytics?
AI traffic video analytics software: detect, track, classify, and count road users from video; report and export results. Built by Road Data Systems (BitRefine group).
Do I need special cameras?
No proprietary camera is required. Use standard CCTV/IP cameras or files (including drone footage). Quality still matters (camera setup).
Is it cloud SaaS only?
No. Typical deployments are on-premise GPU servers you control. Distributed workers and optional cloud-hosted manager patterns exist for scale (edge vs cloud).
What classes are supported?
Detectors cover common road users; vehicle-class models extend to 12+ types. Map labels with class groups. Custom modules can add niche types (custom classes).
Video and accuracy
What resolution and fps should I use?
Prefer 1080p at 25–30 fps. Industry minimums around 640×480 @ 10 fps exist but often fail for pedestrians and dense tracking—treat them as emergency floors, not targets.
Can it count pedestrians and cyclists?
Yes, when they are large enough in frame and modules/class filters include them (counting guide).
Does night work?
Often for vehicles with decent illumination/IR/WDR. Always QA night segments separately before promising ped accuracy.
How do we prove accuracy?
Audit 10–15 busy minutes manually against line totals; keep event exports for disputes. Accuracy is scene-dependent.
Workflow
What is a Location / Source / Scan / Report?
Location = site; Source = video input; Scan = AI config + geometry + processing; Report = widgets/exports over scan data. Optional Merging combines scans.
Can we reprocess if the brief changes?
Yes—adjust geometry or classes and process again. That is a core advantage over manual counts.
How do we get O–D matrices?
Name in/out lines, use path/first–last logic, export and pivot (O–D article).
Drones?
Supported as file sources; use drone-oriented detectors when installed; follow flight best practices (drone guide).
IT and privacy
Hardware minimum?
Linux x86_64, NVIDIA GPU with recent driver, Docker, ~32 GB RAM recommended, tens of GB disk—see install guide.
Default port?
9006.
GDPR / privacy?
Process locally; minimise plates/snapshots; zone-scope users and API keys (privacy).
API access?
Yes—Data API for tracks, metrics, assets (licence permitting) (IoT article).
Commercial
How do we try it?
Contact Road Data Systems for a demo or PoC on your footage: roaddatasystems.com/analytics.
Where is the company based?
Hong Kong (Road Data Systems / BitRefine group), with wider BitRefine presence in Asia, Europe, and the US (about).
Can we white-label reports?
Report layouts and class-group labels are configurable; discuss branding needs in onboarding.
What if a scan fails?
Check source media, GPU health, and module licence; product docs cover FAILED statuses and troubleshooting. Most first-week failures are upload/format or geometry-on-empty-frame issues—not model collapse.
Troubleshooting quick hits
| Symptom | Try this first |
|---|---|
| No detections | Pause on a clearer frame; lower confidence carefully; check lighting |
| Double counts | Move line off the stop-line queue; review tracker settings |
| Empty report | Confirm COMPLETED + time range + Apply |
| Slow processing | Reduce concurrent pipelines or resolution; check GPU utilisation |
| Missing class | Enable vehicle-classes module; configure class groups |
Part C — Learning path (bookmark this)
| Order | Article |
|---|---|
| 1 | AI vs manual surveys |
| 2 | Counting with lines/zones |
| 3 | Install |
| 4 | Camera setup |
| 5 | Your specialty: O–D, drones, speed, ROI, privacy, or adaptive |
Still stuck? Send a sample frame (not necessarily full video) with your question to Road Data Systems—most FAQ issues are placement or expectations, not mysterious model failure.