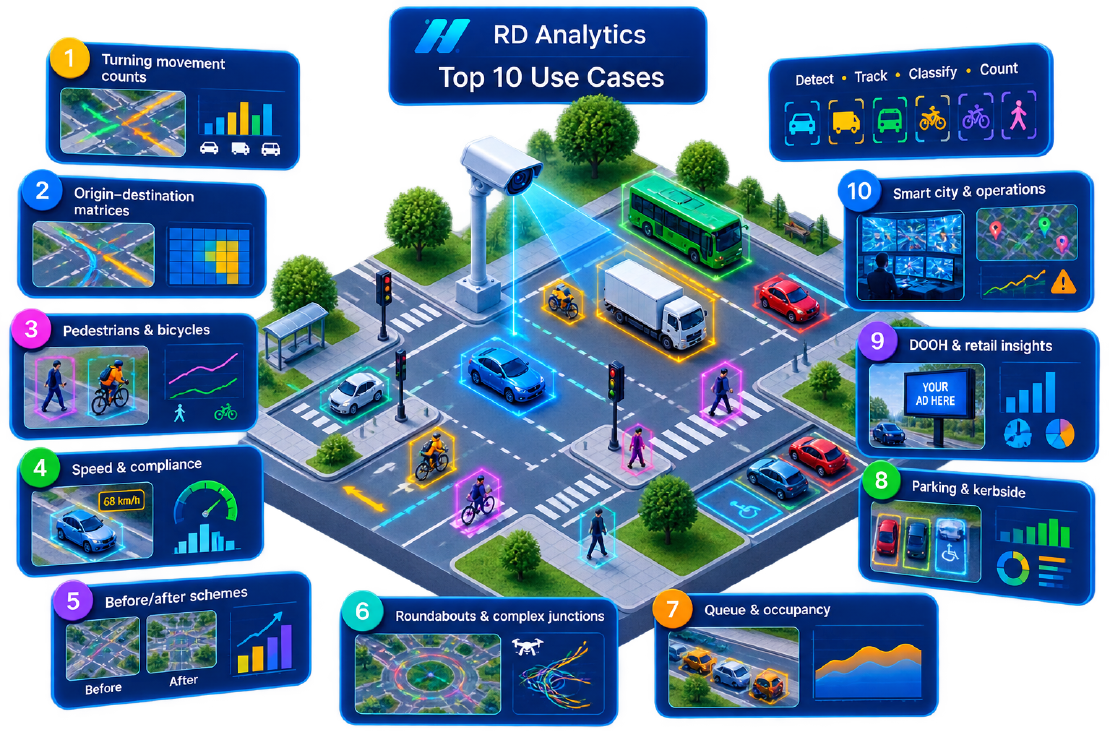
Traffic video analytics use cases now stretch far beyond a one-day turning count. The same AI stack—detect, track, classify, count—supports planning surveys, safety schemes, parking, DOOH, and smart city video AI programmes. Other video-analytics vendors cover a similarly wide field—smart intersections, parking, modelling, safety, and real-time operations. This article consolidates the ten use cases we see most often with RD Analytics, and what each needs from geometry and outputs.
1. Turning movement and approach counts
The classic brief: classified volumes by approach and turn for signal timing or capacity analysis.
Geometry: counting lines on entries/exits, directional filters.
Outputs: quantity by line/class, 15-minute profiles, CSV/Excel.
Why video: full peak coverage, replay QA, pedestrians optional in the same pass.
Buyer tip: insist on a 10-minute manual audit window in the method statement—it closes procurement debates faster than accuracy marketing slides.
2. Origin–destination and path matrices
Observed entry→exit cells for models and TIAs without roadside intercepts.
Geometry: named in/out lines; optional multi-camera merge.
Outputs: first→last line pivots, trajectory exports.
Why video: complete in-view paths for the filmed window (deeper guide).
Buyer tip: define geographic scope in the proposal (“O–D through the junction,” not “citywide demand”).
3. Pedestrian and bicycle studies
Footway demand, crossing compliance context, and cycle lane usage.
Geometry: dedicated ped/cycle lines and waiting-area density zones.
Outputs: multimodal class splits, occupancy over time.
Why video: aligns people and vehicles on one timeline (counting guide).
Buyer tip: camera aim decides success—pedestrians need pixels; highway-height CCTV may be vehicle-only.
4. Speed and compliance profiles
Section speeds, bins, and overspeed lists for safety and design checks.
Geometry: dual speed lines + surveyed distance.
Outputs: average section speed series, histograms, track exports (speed article).
Buyer tip: separate engineering speed studies from enforcement-grade claims unless the device is certified for that use.
5. Before/after scheme evaluation
Prove whether a change worked—LPI, banned turn, calming, bus priority.
Geometry: freeze scan templates; repeat after opening.
Outputs: same metrics, two periods, side-by-side charts.
Why video: identical method beats “different manual crews, different bias.”
Buyer tip: archive the scan config with the as-built drawings so year-2 evaluation is trivial.
6. Roundabout and complex junction analysis (often drone)
Weaving, gap behaviour context, and clear O–D when ground cameras are blind.
Geometry: bird’s-eye lines; stabilizer if needed.
Outputs: paths, class counts, optional speeds (drone practices).
Buyer tip: book peak flights, not lunchtime demos; battery gaps in the peak invalidate the matrix.
7. Queue, occupancy, and spillback diagnostics
Explain bus delay and gridlock risk with presence, not only volume.
Geometry: density/occupancy zones on approaches.
Outputs: density by zone/class, threshold event counts.
Why video: sees the queue cameras already watch.
Buyer tip: agree numeric occupancy thresholds with operators before calling something a “failure event.”
8. Parking and kerbside monitoring
Occupancy of bays, misuse of accessible spaces, turnover proxies via dwell-related presence.
Geometry: zones per bay or kerb segment; class filters.
Outputs: occupancy time series, snapshots for enforcement policy (not necessarily ticketing).
Industry parallel: smart parking is a frequent theme in market case studies.
Buyer tip: policy and signage changes often deliver more than another sensor—use video to prove misuse patterns first.
9. Outdoor advertising (DOOH) and roadside retail insights
Audience proxies: volumes by class, speed past a screen, peak profiles for ad rotation.
Geometry: lines/zones aimed at the relevant carriageways; optional make/model modules where licensed.
Outputs: time-of-day charts, class mix, speed context.
Why video: RD Analytics is already positioned for DOOH traffic counters on the product site.
Buyer tip: advertisers buy audiences and attention proxies—pair volume with speed so “impressions” reflect glance opportunity.
10. Data feeds for models, BI, and smart city platforms
Surveys should not die in a PDF. Tracks and metrics feed Vissim/SATURN inputs, data warehouses, and IoT platforms.
Geometry: whatever the study needs.
Outputs: Data API, CSV/NDJSON exports, integration with platforms such as RD Fusion (integration article).
Industry parallel: modelling calibration from video; city real-time monitoring requirements.
Buyer tip: lock class-group labels as an API contract before the first ETL job ships.
How consultancies and cities combine use cases
Real programmes rarely buy a single tile from the grid. A corridor study might pair (1) TMCs + (4) speeds + (7) occupancy; a Vision Zero pilot might pair (3) multimodal + (4) speeds + (5) before/after; a modelling job might pair (2) O–D + (10) API export. RD Analytics is useful here because geometry and class groups are reused: you do not re-procure a “speed product” and a “count product.”
Consultancy-oriented writing from other vendors (fast turnaround counts, microsimulation calibration from video) and intersection/parking stories show buyers rewarding platforms, not point tools. Match that expectation in your RFP language: ask vendors which of the ten they cover with one workflow.
Choosing the right first use case
| If your pain is… | Start with # |
|---|---|
| Expensive manual TMCs | 1 |
| Weak model inputs | 2 or 10 |
| Vision Zero / school safety | 3 + 4 + 5 |
| Roundabout redesign | 6 |
| Bus reliability | 7 |
| Parking complaints | 8 |
| Ad network yield | 9 |
Most organisations should pick one junction and one use case, prove the pack, then expand. RD Analytics keeps the workflow stable as you grow: location → source → scan → report, on hardware you control.
Avoid the anti-pattern of instrumenting twenty sites on day one. Competitor city-ops writing repeatedly notes that pilots fail when staff cannot act on the data. A sharp pilot with a named decision (“retime signal X / defer rebuild”) beats a sprawling dashboard nobody owns.
What RD Analytics brings across all ten
- 12+ class depth with configurable class groups
- Lines, zones, speed segments, drone-capable detectors
- Interactive reports (tables, charts, scene overview)
- Concurrent GPU processing of file/batch sources
- Export and API for downstream systems
- Multi-user browser access without desktop installs
Next step
Map your current annual survey spend to the list above. If three or more use cases appear, you do not need three products—you need one video analytics platform and clearer briefs.
Explore RD Analytics or contact Road Data Systems to match a pilot site to the highest-value use case on your network.