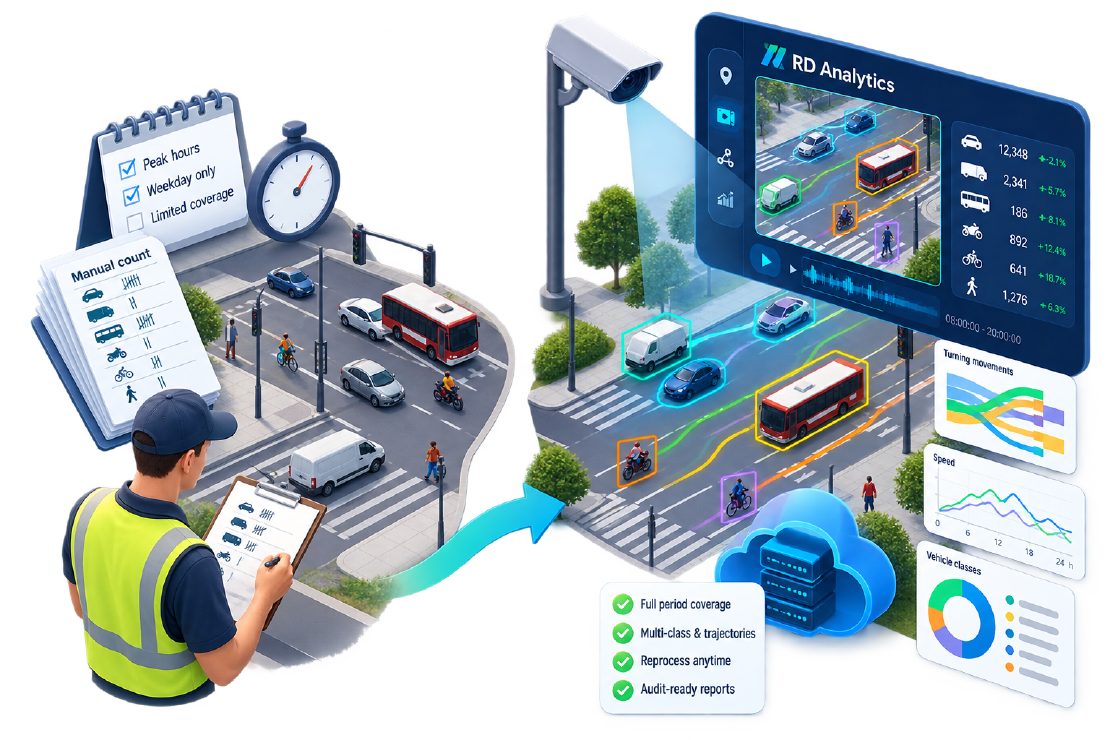
Traffic surveys still shape signal timing, junction redesigns, and safety budgets. For decades that meant clipboards at the curb, short observation windows, and spreadsheets that arrived days later. Manual counts still work for tiny spot checks. For anything that must be longer, multi-class, or defendable in a review meeting, they are slow to scale and hard to re-check.
Video-based AI traffic analytics changes the economics. Record the scene once—from existing CCTV, a temporary camera, or a drone—then extract classified volumes, trajectories, speeds, and reports as often as the brief demands. Platforms such as RD Analytics are built for that workflow: deep-learning detection and tracking on a GPU server, geometry drawn in a browser, and deliverables you can audit and export.
This article compares AI traffic analytics vs manual surveys for the people who commission and deliver counts—consultancies, city traffic teams, and infrastructure owners—and spells out the video traffic survey advantages that show up in cost, quality, and project risk.
Why manual surveys struggle under real briefs
A classic manual turning-count puts observers on each approach for a defined peak. The method is familiar. The failure modes are predictable:
- Coverage is thin. Teams sample a few peak hours or weekdays. Off-peak, weekend, school-holiday, and incident patterns rarely make the brief—yet they often drive complaints and redesign arguments.
- Accuracy drifts with fatigue. Long shifts, night work, rain, and glare wear people down. Class mistakes pile up exactly when volumes are highest.
- Fine classes are wishful thinking. Separating vans from light trucks, small buses from standard ones, or spotting micromobility reliably is hard at speed with a tally sheet.
- There is no replay. If a client challenges a left-turn volume, the hour is gone. You can argue methodology; you cannot re-watch the movement.
- Labor scales with every approach and hour. A four-leg junction for twelve peak hours is four people × twelve hours—plus travel, weather contingency, and data entry—before anyone builds charts.
- Outputs fragment. Contractor formats differ, QA is opaque, and last year’s count rarely becomes a reusable asset for next year’s model update.
Pneumatic tubes and inductive loops help with raw volume, but they still leave gaps in rich classification, pedestrians, path-based origin–destination (O–D) work, and flexible study geometry without extra kit.
Video analytics answers a simple need: capture once, measure many times, and keep proof.
A concrete contrast: one junction, one brief
Suppose a consultancy must deliver approach volumes and turning movements for a four-leg urban junction ahead of a signal redesign.
| Manual | AI video (RD Analytics) | |
|---|---|---|
| Field effort | Four counters for each surveyed period; weather and shift relief | One camera setup (or existing CCTV / short drone flight); no curb tally team |
| Study window | Usually peaks only (cost explodes for 24h / multi-day) | Same recording supports peaks, off-peak, and multi-day if you keep filming |
| If the brief changes | Re-mobilise people or live with the original sheet | Redraw counting lines and reprocess the same files |
| Client challenge | Method statement and trust | Timeline review, object snapshots, CSV/Excel export |
| Staff skill used | Attention under traffic | Geometry setup, QA of edge cases, report packaging |
The headline saving is not “AI is magic.” It is that human time moves from roadside tallying to setup and quality review, while coverage scales with storage and GPU capacity instead of headcount. For 24-hour or multi-day studies, that gap becomes decisive.
What AI video counting actually adds
Under the hood, models detect road users, track them across frames, classify them, and record events when they cross virtual lines or enter zones. In RD Analytics that sits in a familiar project shape: define a location, attach a video source (file or batch), configure a scan (AI modules + drawn geometry), then publish a report.
Engineers work in a web browser. Recognition, storage, and reporting run on your server. You do not need proprietary roadside counters—standard cameras or UAV footage plus a GPU machine are enough. That is the first structural video traffic survey advantage: reuse capture assets you already own or can rent locally.
Advantage 1 — Coverage that does not multiply staff
Manual cost grows linearly with approaches × hours. Video flips that curve: film once, upload files or a batch of clips, process on the GPU (RD Analytics can run multiple scan pipelines concurrently within the server limit), and—if the client revises the brief—reprocess with new lines instead of remobilising a team.
For programmes that repeat surveys seasonally, saved scan configurations become templates. Manual labour almost never compounds that cleanly.
Advantage 2 — Counts you can defend
Public clients and peer reviewers increasingly ask how a number was produced. AI video surveys leave a trail manual sheets cannot:
- Adjustable detection and tracking (confidence, filters) with visual feedback
- Per-object detail—time, class, line, direction, and optionally speed—not only hourly bins
- Scene images and object snapshots as evidence
- Replayable exports (CSV/Excel) and, where needed, API access for formal QA pipelines
When a turning movement is disputed, you open the timeline and inspect crossings. That auditability is often what closes the meeting.
Advantage 3 — Classification beyond the roadside tally sheet
Observers default to coarse schemes (car / LGV / HGV / bus / cycle) because finer splits fail under load. RD Analytics is built for multi-class work: detectors cover people and common vehicles; dedicated class models extend to a richer set (cars, pickups, vans, bus and truck variants, special plant, bicycles, and more—aligned with the product’s 12+ class positioning). Administrators map raw detector names into class groups that match local highway or client labels, so reports speak the language of the tender—not the model’s internal vocabulary.
Pedestrians and vehicles are counted in the same pass. Complete-street and shared-space studies no longer need a second crew only for people walking.
Advantage 4 — Study design drawn on the scene
Instead of assigning a person to each approach, you draw the brief on the video frame: counting lines for volumes and turns, zones for occupancy or density, direction filters, and speed segments (two lines plus a real-world distance). Drone views of roundabouts and large junctions benefit from the same toolkit—often with clearer paths than ground cameras can see.
At big intersections where each leg has its own camera, merge results from multiple completed scans so the report describes the whole junction, not four disconnected files. (Deeper O–D matrix and drone capture practice deserve their own guides; the point here is that video makes path-based analysis practical without a special roadside campaign.)
Advantage 5 — Deliverables that outlive the peak-hour table
Manual packs are often a spreadsheet of 15-minute bins. Video analytics naturally yields more: volumes by line and class, crossing event lists for QA, density and section-speed series, interactive charts and tables, and exports into the formats clients already use. A Data API can feed BI tools or wider smart-city platforms when the survey is only the first step.
Decision-makers get the summary slide and the evidence underneath it.
Advantage 6 — Start with files; grow into a capability
Most survey work still begins with SD-card dumps or temporary poles. RD Analytics fits that reality: upload a file or a batch, configure, process. The same software package can later support heavier concurrent workloads and, where licensed, stream-oriented deployments. Buyers are not purchasing a one-off gadget; they are standing up a reusable traffic-data capability—on infrastructure they control, without depending on a public cloud for core recognition.
Side-by-side summary
| Criterion | Manual survey | AI video analytics |
|---|---|---|
| Labor | Linear with hours × approaches | Front-loaded setup; GPU scales coverage |
| Study length | Peaks by default | Full day / multi-day from recordings |
| Classes & pedestrians | Coarse; people often separate | 12+ classes; people in the same pass |
| Speeds, density, paths | Extra kit or special surveys | In-scene geometry + trajectory logic |
| Audit | Rare | Timeline, snapshots, exports |
| Reuse | Low | Saved scans, merges, report layouts |
| Hardware | People (± tubes/loops) | Cameras or drone + GPU server |
When manual (or hybrid) is still the right call
AI does not erase every human observation. Very short ad-hoc counts, sites where video cannot be obtained, or rare events that need a trained eye on site may stay manual. Poor angles, heavy occlusion, or weak resolution still demand better capture—or careful supervised tuning of confidence, tracking, and geometry.
The pattern that works for most agencies and consultancies is hybrid: video for the bulk survey, humans for edge-case review and stakeholder walkthroughs.
Try it on one real site
A low-risk proof does not need a city-wide rollout:
- Pick one junction with existing CCTV or a short temporary recording (a few peak hours is enough).
- Upload the footage, draw counting lines on a representative frame, and run processing.
- Build a simple report—volumes by line and class—and export CSV or Excel for the client pack.
- Optionally map classes to your local labelling scheme so the table matches the brief.
Compare that pack to the last manual sheet for the same site. The differences in coverage, class depth, and defensibility usually make the business case without a long RFP.
Ready to see it on your own footage? Explore RD Analytics or contact Road Data Systems for a walkthrough with a sample junction clip.