
12+ object classes


Accuracy is our A-priority
RD Analytics is based on deep learning algorithms that mimic the functions of the human brain. Even in unsupervised mode, this powerful technology allows you to achieve results you might not have imagined before.
And you can go even further!
RD Analytics also offers a fully supervised mode that lets you extract maximum value from available video. The system shows exactly what it is doing, frame by frame, giving you full control over the recognition process and allowing you to interactively adjust detection, tracking, and classification parameters.
See what you can extract from the video
Count vehicles and pedestrians
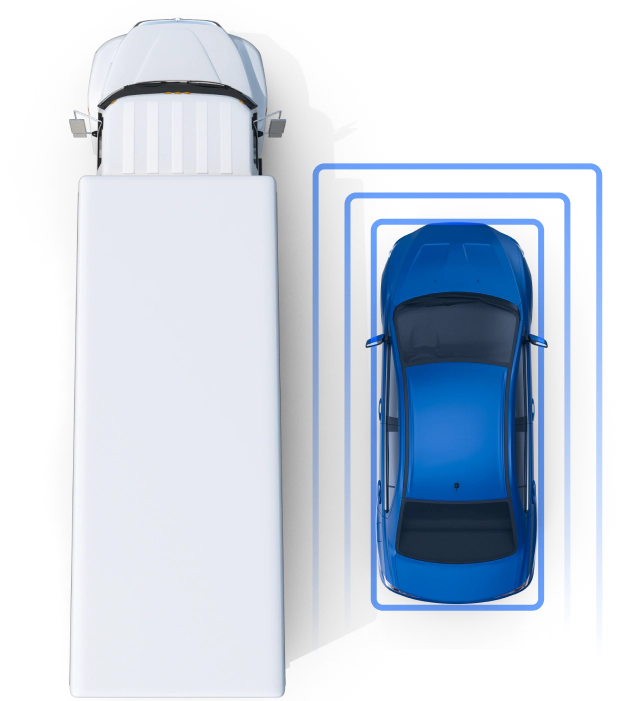
The simplest way to start counting detected vehicles is to draw one or more virtual lines. When a vehicle crosses a line, RD Analytics adds it to your statistics. The system stores not only aggregated numbers, but also detailed data such as timestamps, vehicle properties, line names, and directions. These details help you refine your reports.
In addition to line-cross counting, you can draw a zone and monitor the number of vehicles inside it at any given moment (in other words, measure occupancy).
In addition to line-cross counting, you can draw a zone and monitor the number of vehicles inside it at any given moment (in other words, measure occupancy).
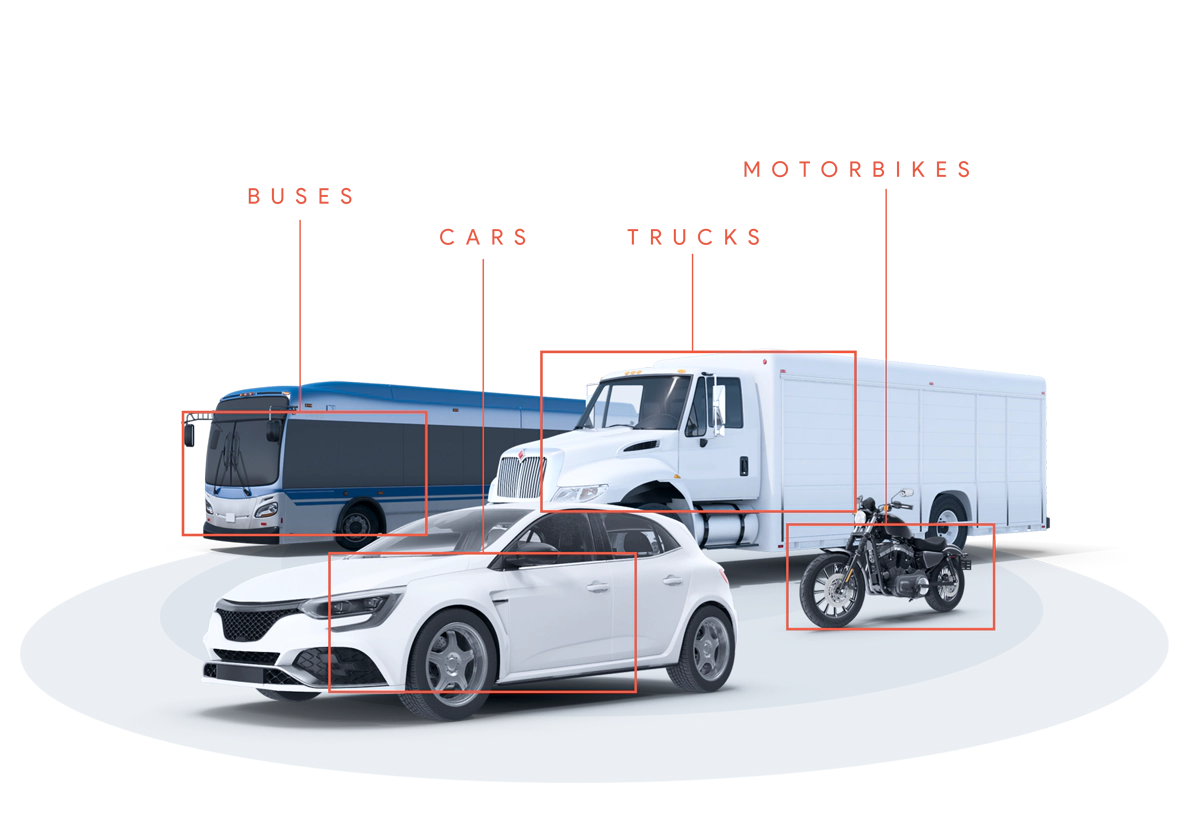
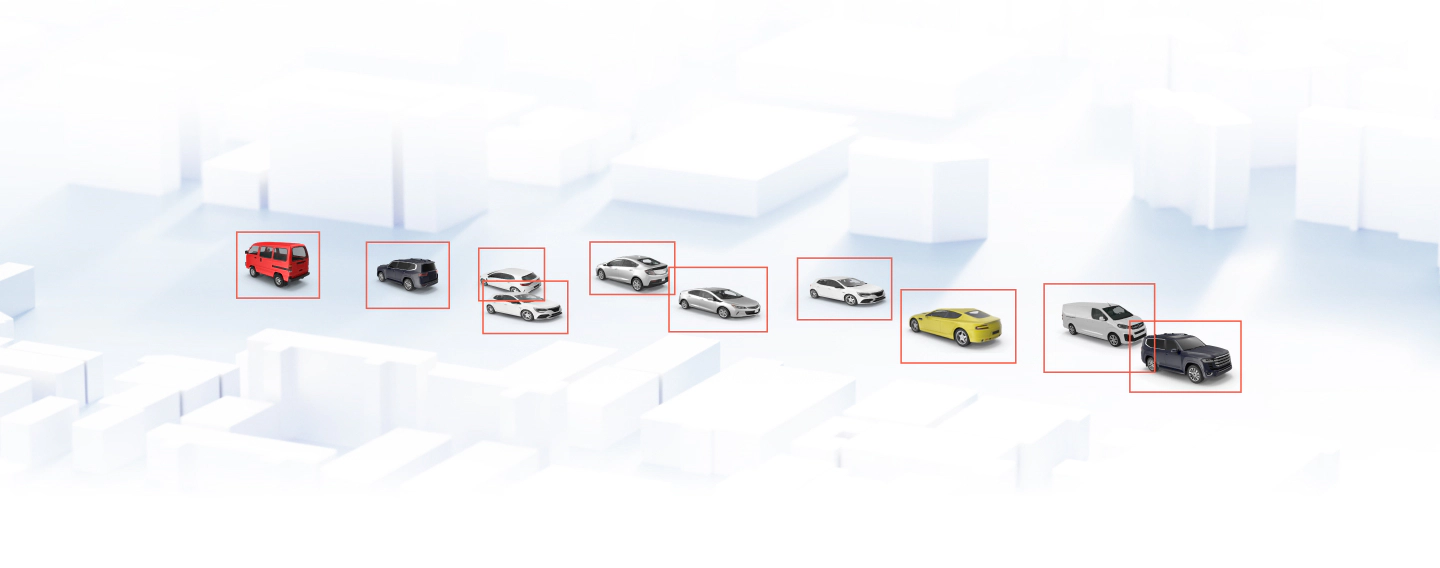
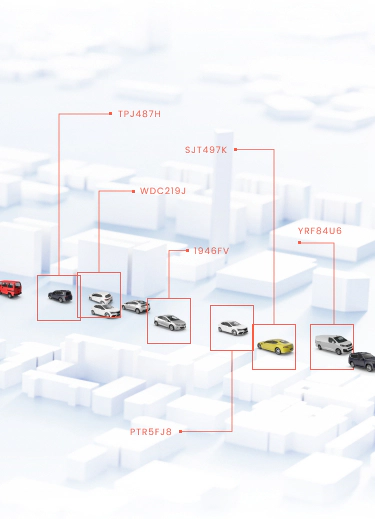
Recognize 12+ classes
RD Analytics recognizes 11 vehicle types separately: motorcycles, cars, pickups, vans, light trucks, standard trucks, long trucks, small buses, standard buses, tractors, and special vehicles such as cranes or other construction machinery. In addition, there is a separate class for pedestrians. You can assign your own class names to detected types according to local classification rules. For example, you can group pickups and light trucks under ‘Class 3,’ and vans and small buses under ‘Class 5.’
The system also supports subclassing: you can define your own vehicle subclasses based on size or, for example, license plate color. The most reliable way to introduce additional classes is to train an extra neural network and integrate it into the recognition pipeline. RD Analytics natively supports external modules.
The system also supports subclassing: you can define your own vehicle subclasses based on size or, for example, license plate color. The most reliable way to introduce additional classes is to train an extra neural network and integrate it into the recognition pipeline. RD Analytics natively supports external modules.
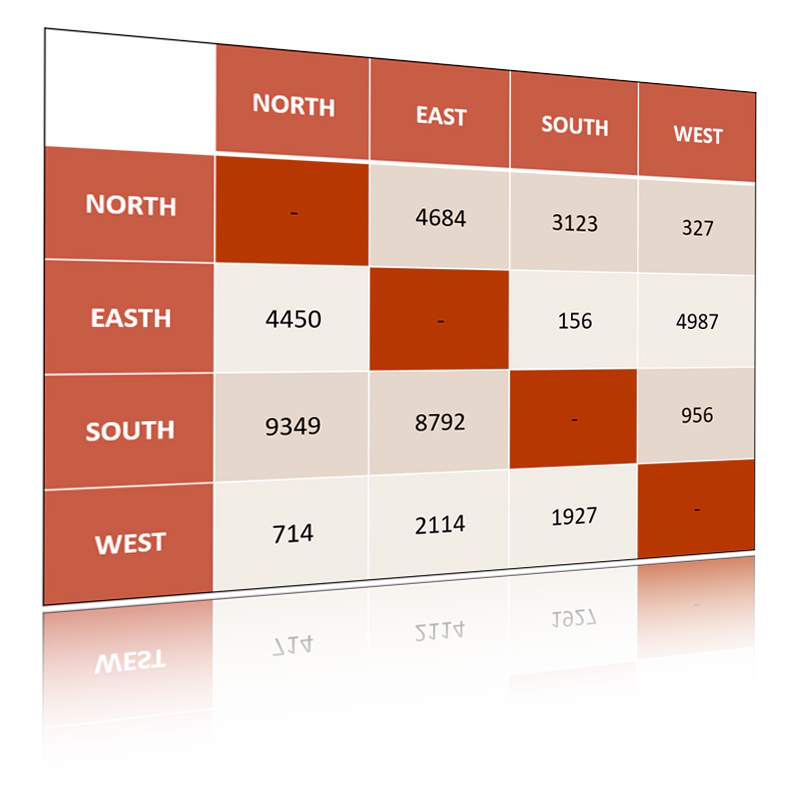
Compose Origin-Destination matrix
When a vehicle crosses a virtual line, the system records both the direction of movement and the line name. RD Analytics can easily provide details on where vehicles come from and through which exit they leave the scene. This information can be converted into numerical reports that list all possible routes and show how many vehicles used each route within a defined time interval. To visualize routes, RD Analytics merges detected trajectories and displays them on a colorful flow map.
Analyze drone video
Drone-based video is an excellent data source for analyzing traffic at large roundabouts or other complex junctions.
First, record video using a standard or tethered drone (UAV). Then copy the video files to your RD Analytics server and start processing. The system will automatically detect all vehicles, count them, extract trajectories, and build origin–destination tables. RD Analytics recognizes pedestrians, motorcycles, cars, vans, trucks, and buses from a bird’s-eye view.
First, record video using a standard or tethered drone (UAV). Then copy the video files to your RD Analytics server and start processing. The system will automatically detect all vehicles, count them, extract trajectories, and build origin–destination tables. RD Analytics recognizes pedestrians, motorcycles, cars, vans, trucks, and buses from a bird’s-eye view.
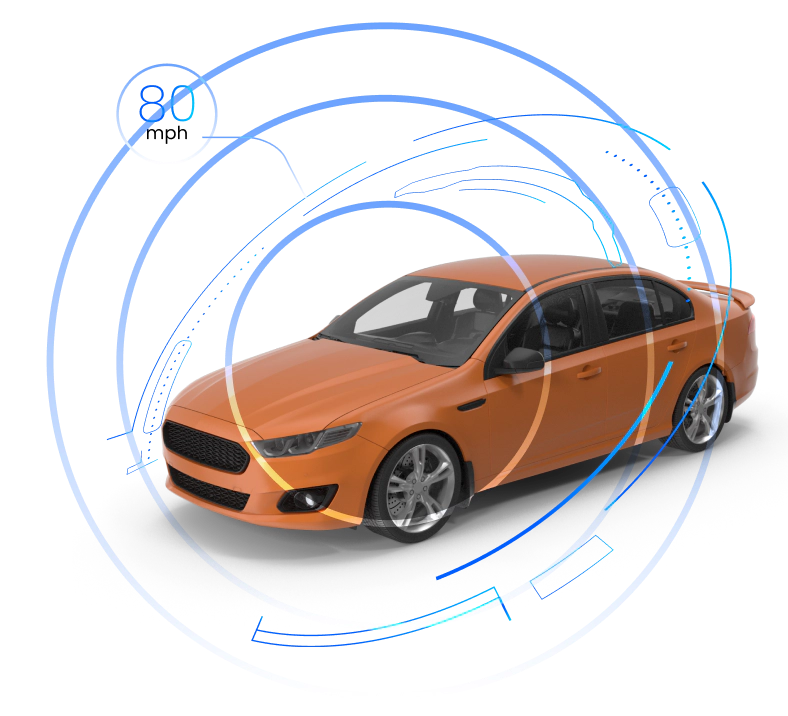
Measure the speed at the road segment
If you need information about average traffic speed and how it changes over time, you simply define the boundaries of a road segment. The system measures individual vehicle speeds as well as average values for the segment. You can draw multiple speed measurement segments within the same scene.
The collected data can be presented as charts or tables showing traffic speed dynamics. Knowing individual vehicle speeds also allows you to identify overspeeding events and visualize them on a timeline to analyze trends.
The collected data can be presented as charts or tables showing traffic speed dynamics. Knowing individual vehicle speeds also allows you to identify overspeeding events and visualize them on a timeline to analyze trends.
Combine data from multiple cameras into a single Origin/Destination report
At large intersections, different legs and exits are often covered by separate cameras. Traditionally, each camera operates independently, resulting in fragmented insights. With RD Analytics, however, you can merge data from all cameras into a single comprehensive report that clearly shows vehicle movement from one leg of the intersection to another.
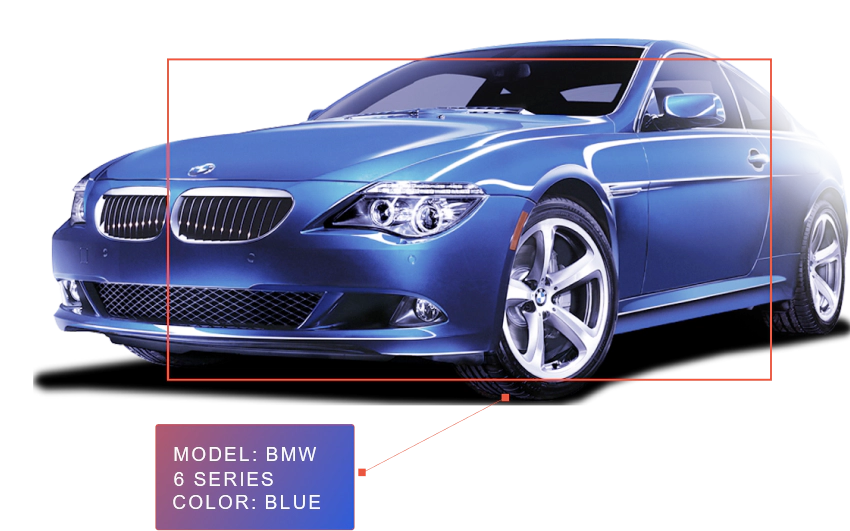
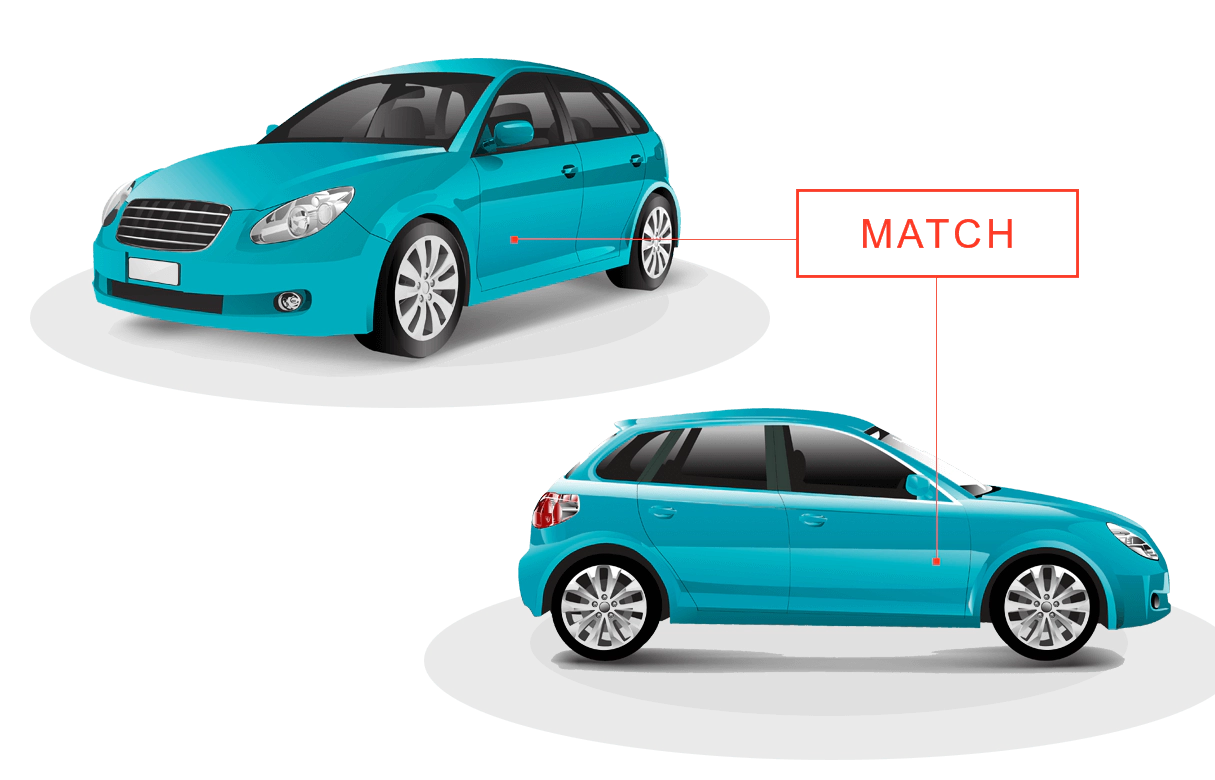
Extra: Recognize car brands
Our neural recognition module can identify vehicle makes and models. For example, you can generate a table showing how many BMW vehicles were detected on a specific road and what percentage they represent of total traffic. The system reliably recognizes approximately 3,000 individual car models, including many domestic brands. A key advantage of RD Analytics is its ability to perform well in real-world conditions, such as poor camera angles, low-resolution video, and challenging lighting
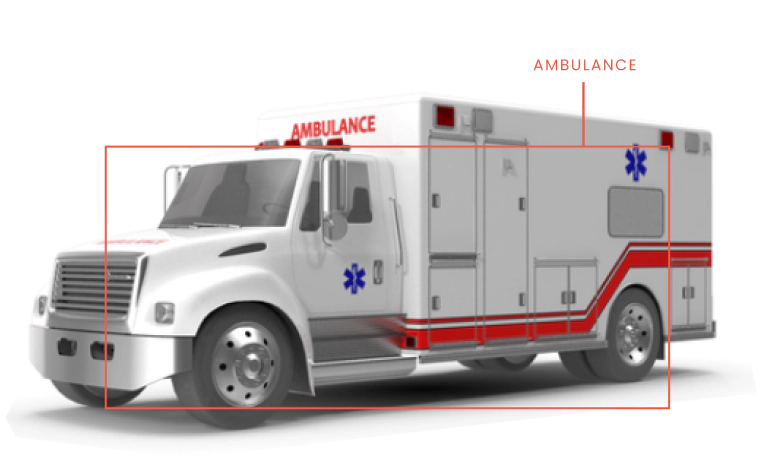
Extra: Insert your own recognition neural module
If you need to detect specific vehicles as a separate class, you can add an additional neural module. For example, to recognize trucks carrying hazardous materials, you can integrate a module that detects special plates or ADR danger labels. RD Analytics supports external modules, so if your task cannot be solved using built-in tools, a tailored neural network can be developed. Custom neural network development is part of our regular services. If you already have your own object recognition model, it can also be ported to RD Analytics.
You can set up your own video analysis server
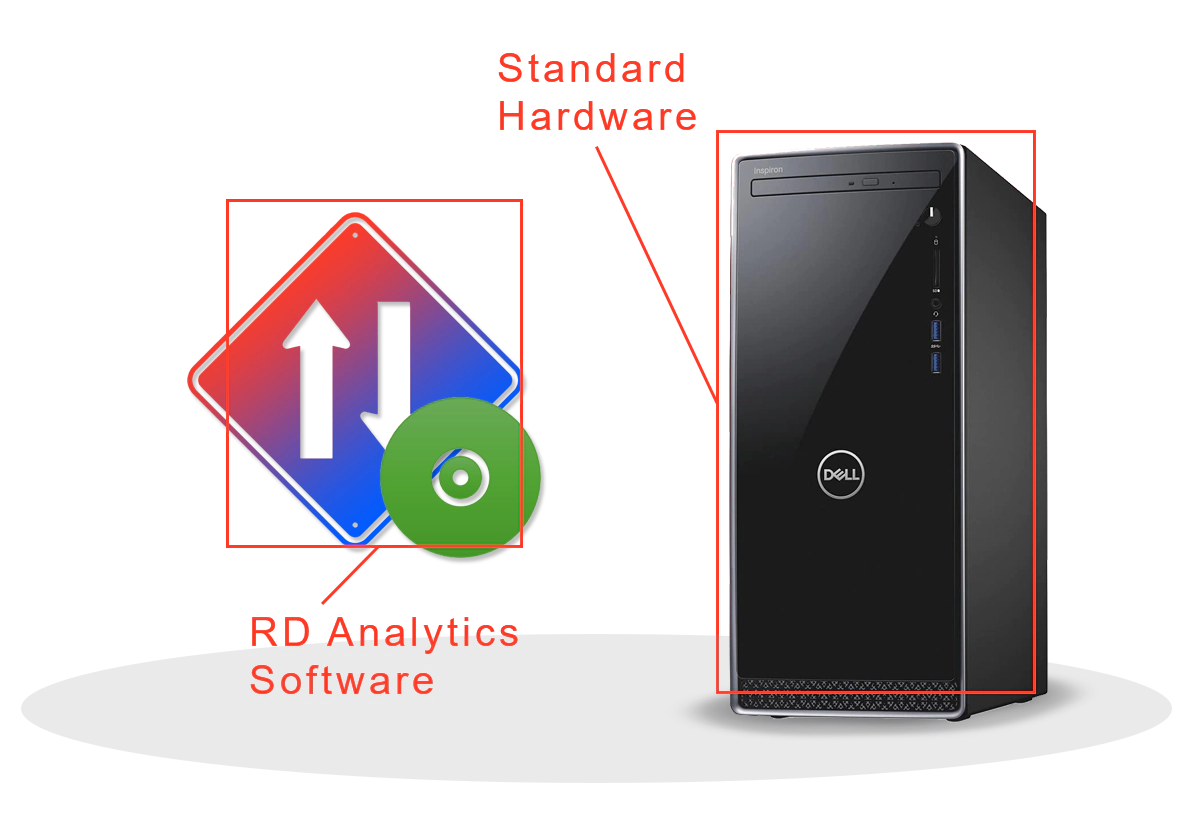
RD Analytics is a software package
We provide the software. All you need to add is a computer with GPU and IP cameras (if you are processing real-time video streams). The good news is that all required components are standard hardware and can be sourced easily from local distributors.
The RD Analytics package includes all essential components: built-in neural processing, an internal database, video storage, reporting tools, and a web server. You do not need to install additional software or connect to external services.
The RD Analytics package includes all essential components: built-in neural processing, an internal database, video storage, reporting tools, and a web server. You do not need to install additional software or connect to external services.
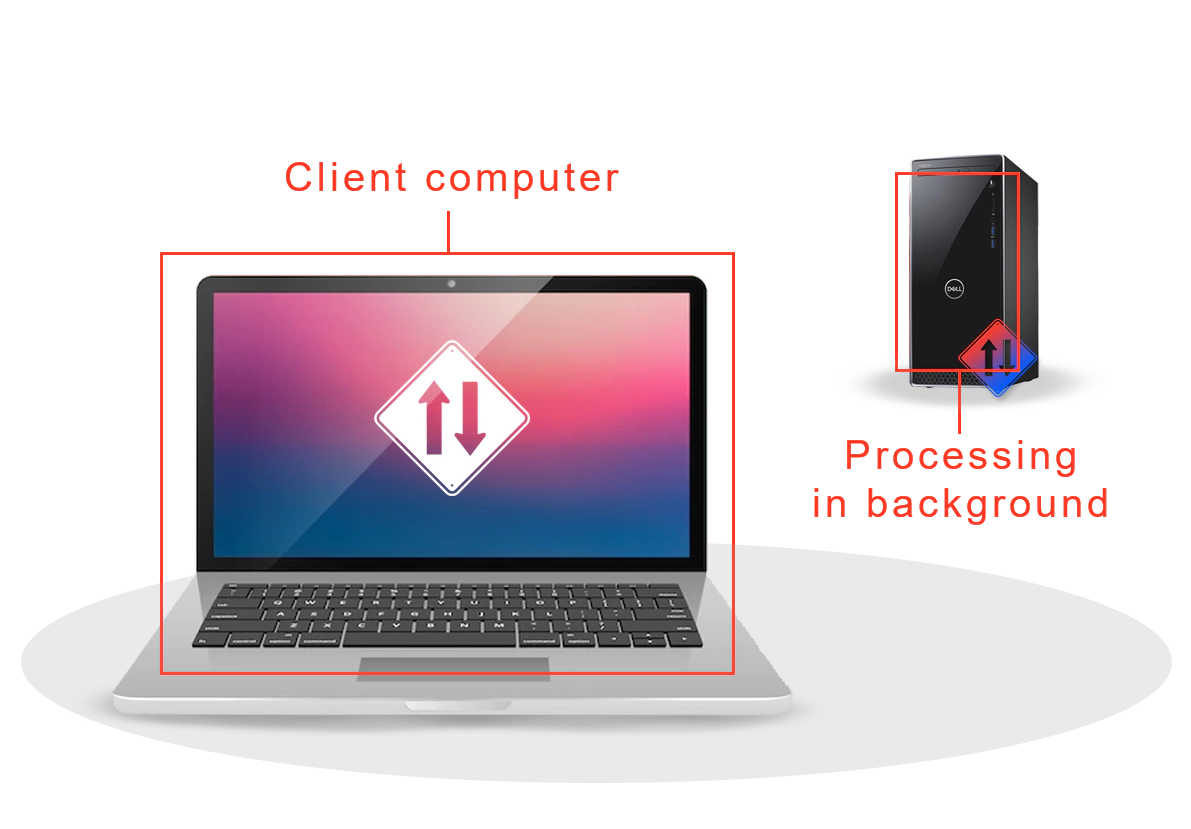
Install it on a server
RD Analytics is a client–server system. It is installed on a dedicated computer (the server), while users connect to it from their workstations. This setup allows you to continue your daily work while video processing runs in the background on the server.
You can access the system from Windows or macOS workstations and laptops. No additional software installation is required—your web browser is all you need.
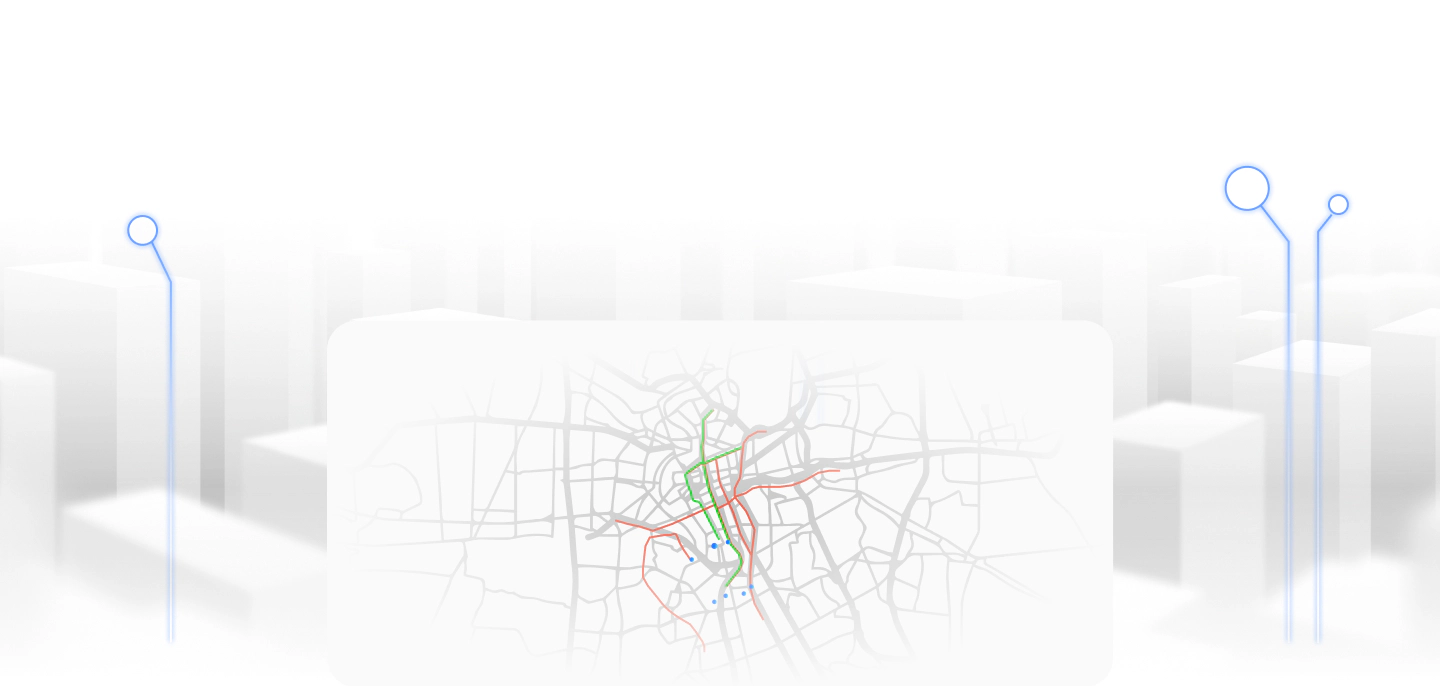
RD Analytics supports a distributed, multi-server architecture and can be scaled up to a city-wide deployment.
Learn more about architecture »
You can access the system from Windows or macOS workstations and laptops. No additional software installation is required—your web browser is all you need.
RD Analytics supports a distributed, multi-server architecture and can be scaled up to a city-wide deployment.
Learn more about architecture »
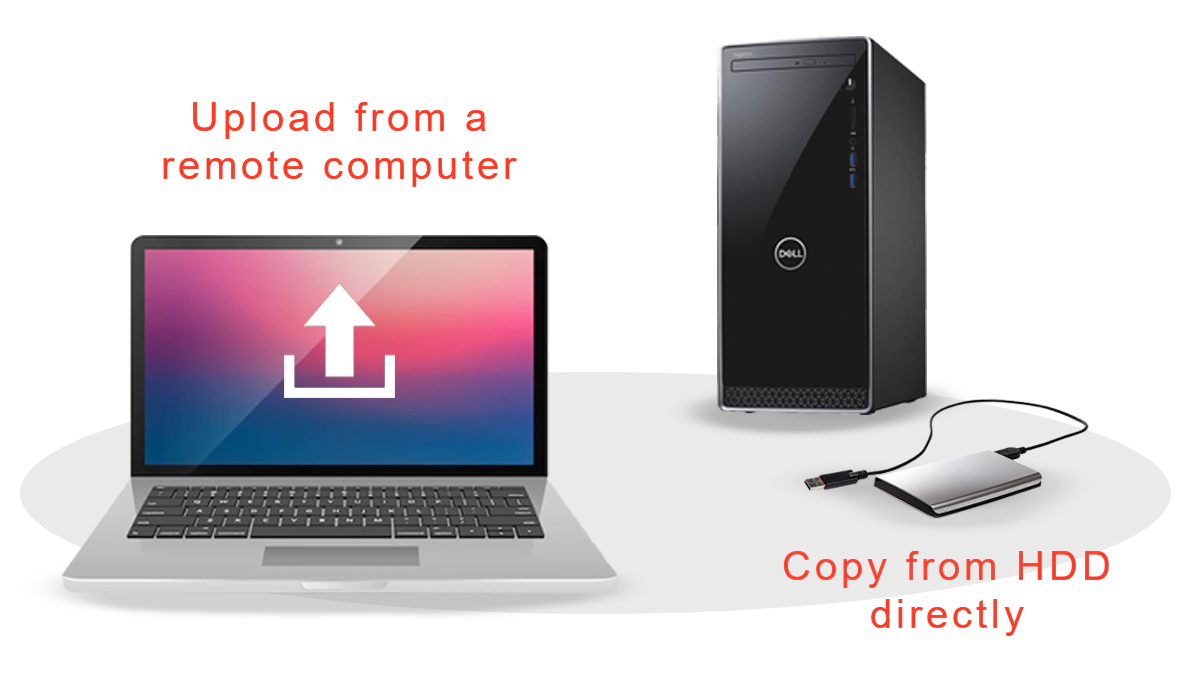
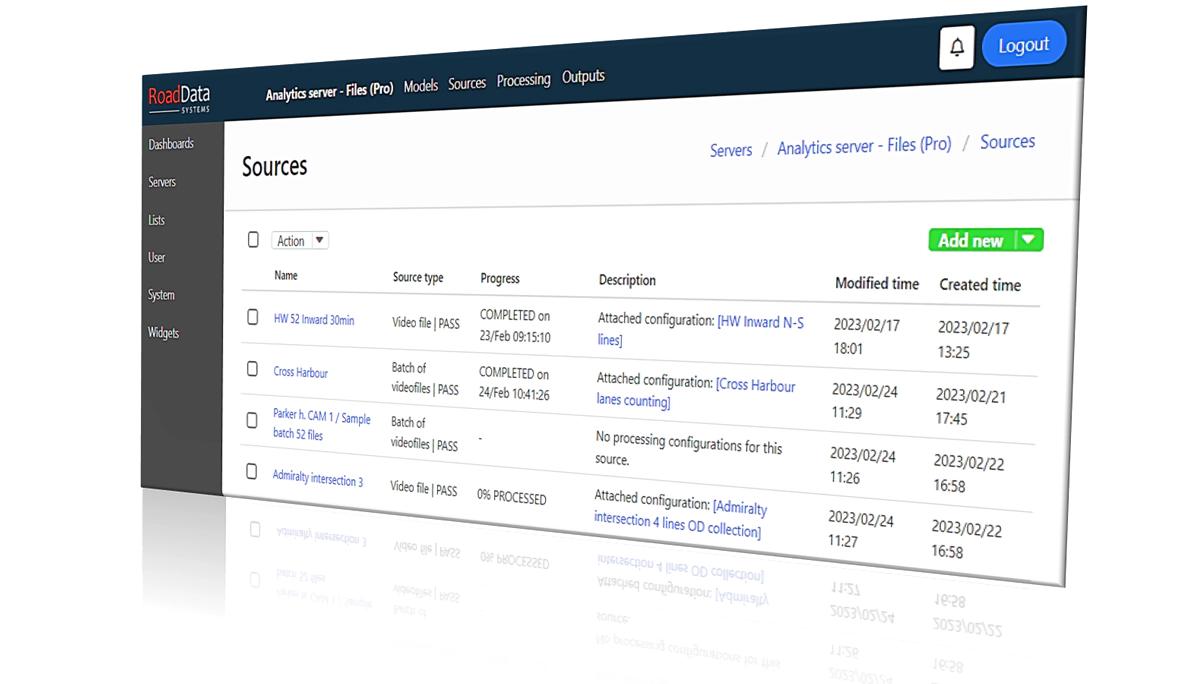
Upload or copy video files
The system accepts both individual video files and file sequences (for example, 24 hours split into a series of one-hour files). You can upload files through the client interface or, if files are very large, copy them directly to the server.
Connecting IP cameras is even simpler: just add the cameras’ IP addresses in the source configuration interface.
Connecting IP cameras is even simpler: just add the cameras’ IP addresses in the source configuration interface.
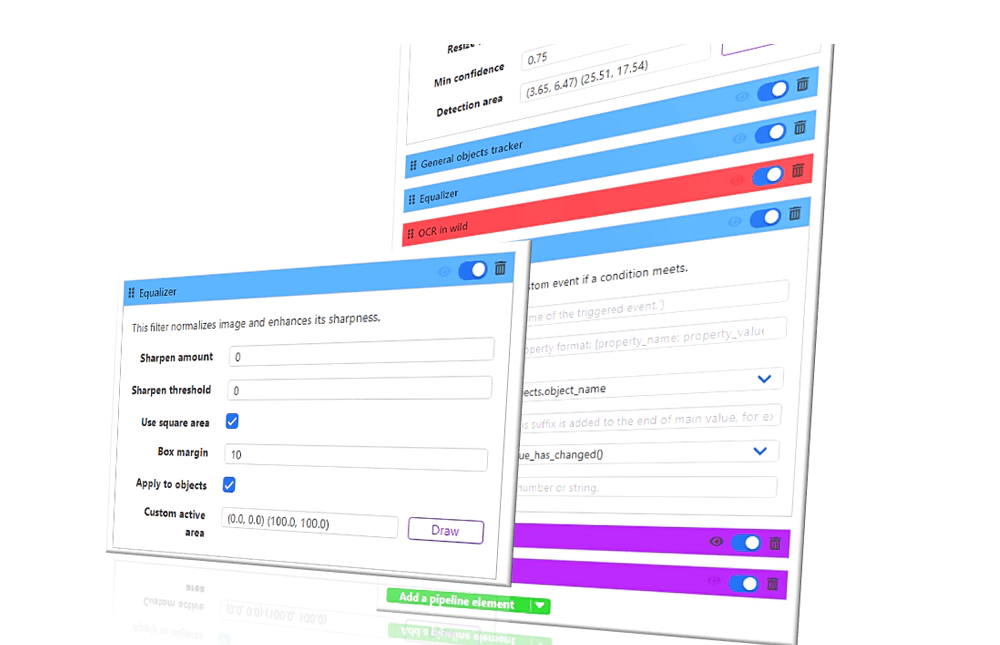
Create recognition task using interactive drag&drop
This is where you define detection zones and counting lines. The task editor is the core part of the interface, where you instruct RD Analytics which objects to detect and how to classify and count them. Tasks can be simple or highly customized by adding modules such as computer vision filters, geometric analysis primitives, or custom ‘IF–THEN’ logic. The interface is fully interactive, so you immediately see the effects of any changes.
Tasks are reusable: you can save a task and apply it to other videos or use it as a template for future projects.
Tasks are reusable: you can save a task and apply it to other videos or use it as a template for future projects.
Do test runs and fine-tune the performance
To ensure accurate recognition and counting, you can run test processing without saving results. If something does not work as expected, you have full control to fine-tune recognition settings. Test runs are especially important when working with low-quality video.
Process your files
Once you are satisfied with the setup, you can start fast-forward processing. When the system finishes, you will receive a notification.
RD Analytics supports concurrent processing, allowing multiple files to be analyzed simultaneously. Processing speed depends on server hardware. For large workloads, you can connect one or more additional servers and distribute tasks among them.
RD Analytics supports concurrent processing, allowing multiple files to be analyzed simultaneously. Processing speed depends on server hardware. For large workloads, you can connect one or more additional servers and distribute tasks among them.
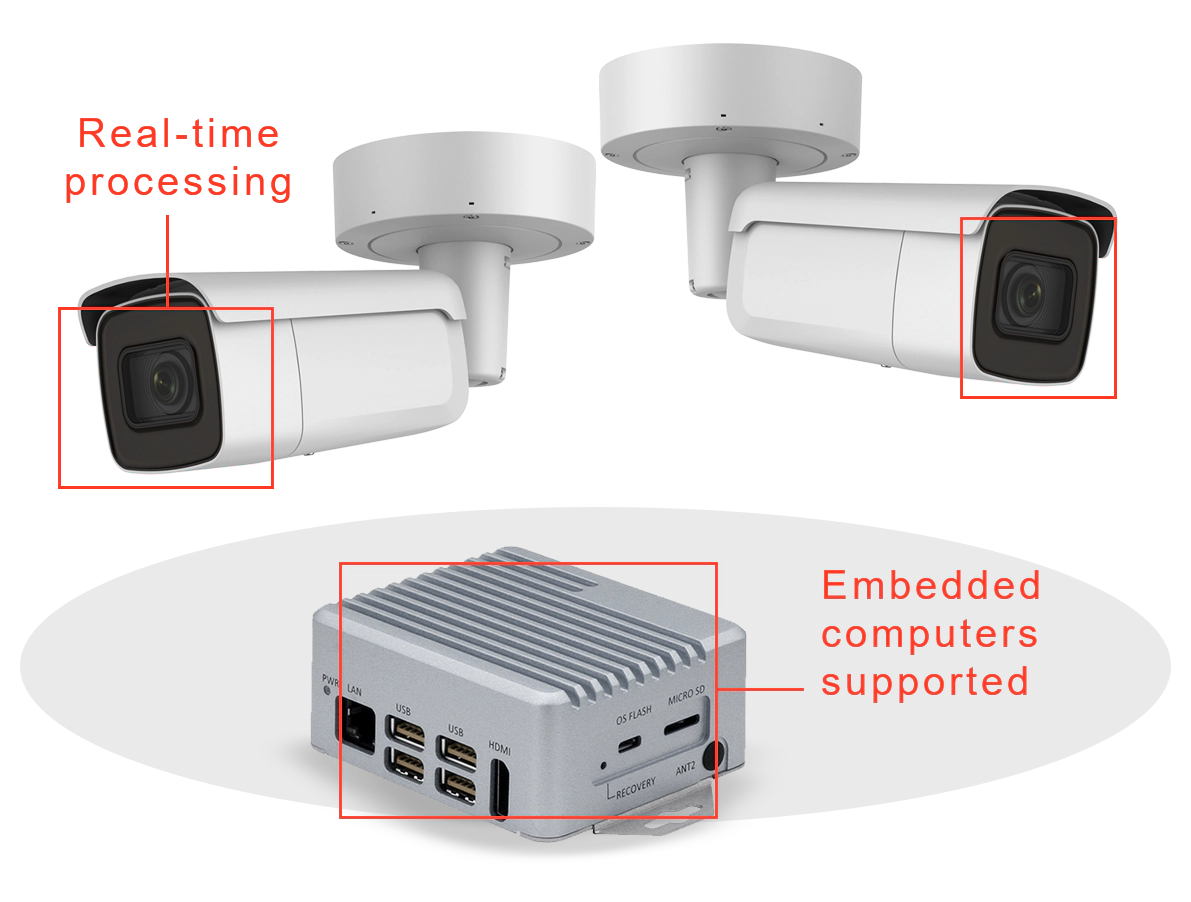
Cameras and real-time processing are also welcome
When IP cameras are connected, the system analyzes video streams and updates reports in real time. If cameras are deployed across multiple locations, you may choose to install compact embedded PCs at each site instead of relying on a single central server.
Explore and export results
The RD Analytics platform offers flexible data visualization tools, allowing each user to present collected information in a personalized way. Timeline charts, bar and doughnut charts, standard and pivot tables are just a few of the available options for building dashboards.
Dashboards are interactive and can display not only counts, but also heatmaps and snapshots of individual vehicles detected by the system.
Need to export data? It’s just one click away. RD Analytics also allows you to save processed video with all detected objects highlighted, providing clear visual proof of recognition quality.
Special use-cases

RD Analytics has even more to offer!
We'll be glad show you how the recognition system works 'live' and answer your questions. Contact our specialists to learn more about our products.