We use dashboards to access collected data and the dashboards consist of widgets.

The system administrators can create many more custom widgets. To create a widget click on Add new button and choose widget type from the dropdown list. The platform supports following widget types:
- Charts - draw various charts
- Pivot table - compose pivot tables
- OD matrix - Origin-Destination matrix table
- Table - compose standard tables
- Events list - compose a table that allows commenting
- Single value - display a single value (count/latest/average)
- Static text - display text
- Filter: date/time - form to enter time intervals
- Filter: switch buttons - custom buttons
- Filter: general - form to add a filter
- Face match - search for a person using an uploaded photo
- Video stream - add a live stream to the dashboard
- Video archive - list the recorded video clips
- Flows heatmap - draw the flow maps
- Servers health - display state of the servers
Once you create a widget, it will be listed in UI Settings section and will be available under the dashboard's Action/Add element.
Charts
User can choose the type of the chart via chart type dropdown: * Vertical bars * Horizontal bars * Line chart (multiple lines if sub-group given) * Doughnut * Pie chart

Pivot table
You need to define the data for columns and the rows. If you display time in the rows, you can also choose time unit.

OD matrix
The Origin-Destination matrix takes names of the lines that you define in your video processing pipelines objects.properties.lines.

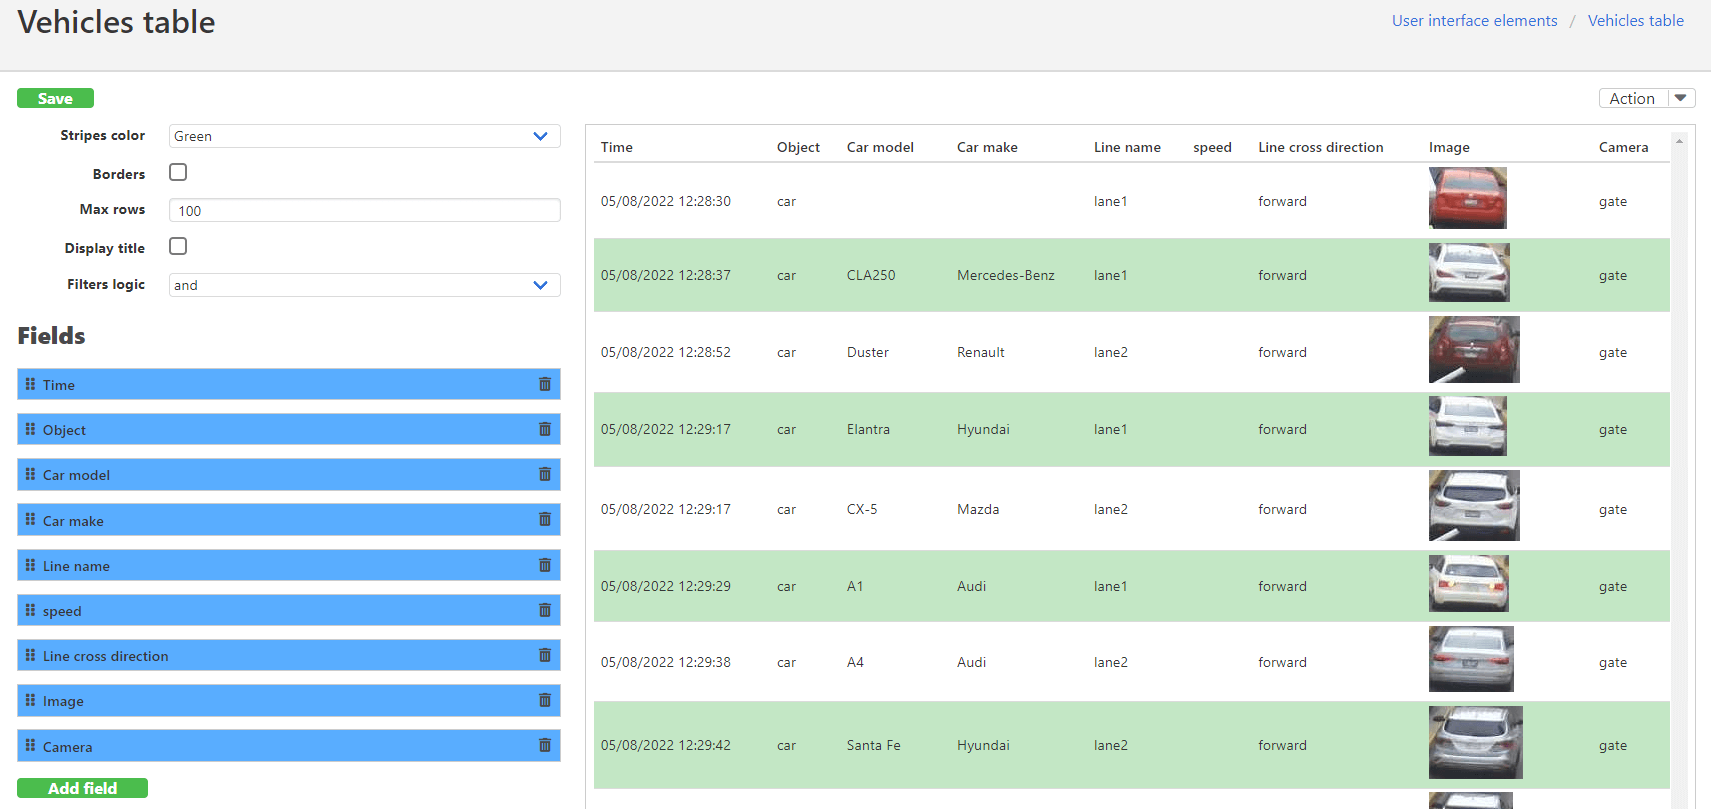
Table
The ‘Fields’ elements define the column names and the values.
Events list
The ‘Fields’ elements define the column names and the values.

Single_value
This widget displays the first, the last, count or average values.

Static_text
You can save a text message and then add it to your dashboard.
Filter date_time
This form is used to choose the time interval for your report. If there's no date-time filter on a dashboard, the dashboard will use the last 7 days as its default time interval.

Filter switch_buttons
This widget allows you creating buttons. Once a button is clicked - a certain filter is applied. You need to add a button and define the condition.


Filter general
A user can add a dashboard-wide filter conditions that will affect all other widgets of the dashboard.

Flows_heatmap
Servers_health
This widget displays multiple blocks with the info about one or more servers.
