Quick start: location → source → scan → report
Requires: A running RD Analytics server (see Getting started and Installation if you have not installed yet). Sign in as Engineer or System admin. Viewers can follow along in read-only mode but cannot create or run.
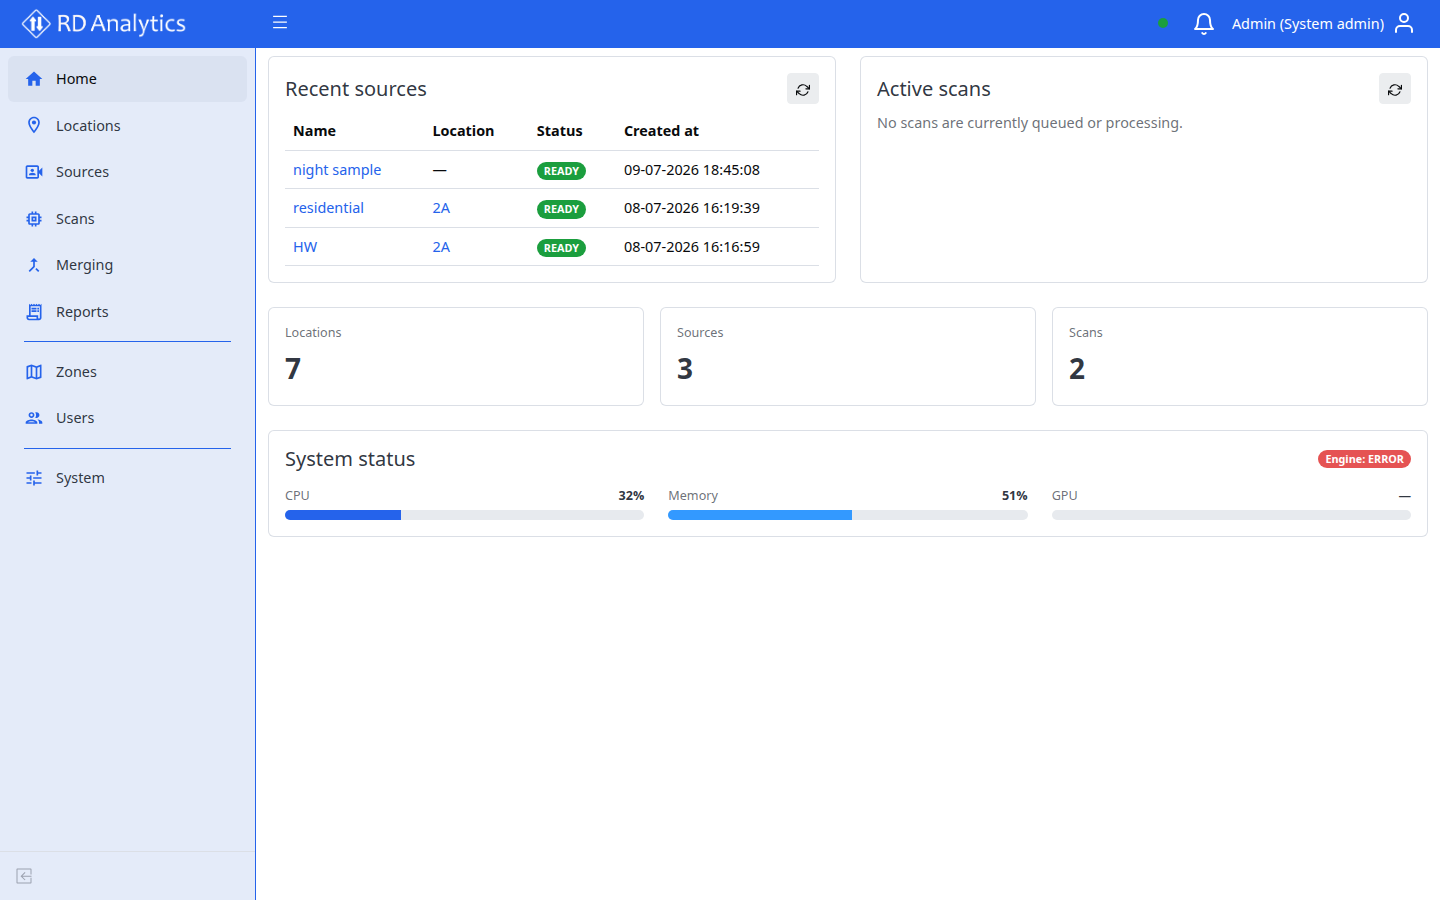
This guide walks through the core workflow in the application sidebar: Locations → Sources → Scans → Reports.
Tip
Merging is optional and used when you need to combine outputs from multiple scans. Skip it for this quick start.
Before you begin
- Sign in to RD Analytics (default first install:
admin@localhost/admin— change the password after login). If someone else installed the server, use the account they gave you. - Confirm you see Locations, Sources, Scans, and Reports in the sidebar. If not, see User roles and access.
- Have a sample video file ready, and note a name for your demo site (for example,
Demo Site).
Step 1 — Create a location
A Location represents a physical or logical site (for example, a junction or facility). Sources are associated with locations.
- Open Locations in the sidebar.
- Create a new location (use Add or the create action on the list page).
- Enter a Name (for example,
Demo Site) and fill required fields. - Save the location.
Verify: The location appears in the Locations list and opens on the details page when selected.
Step 2 — Add a source and upload media
A Source is a video input (typically a Video file or batch of files).
- Open Sources in the sidebar.
- Create a new source and assign it to the location from Step 1.
- Complete source-specific fields (type, name, upload as required).
- If the source type uses file media, open the source and use the Files tab (or create-time upload) for your sample video.
- On Details, optionally set Rotate and resize width/height if the footage orientation needs correction.
- Wait for upload and processing indicators to finish before continuing.
Verify: The source appears in the Sources list with the correct location. The Files tab shows your uploaded media when applicable.
Step 3 — Create and configure a scan
A Scan is the analysis setup for your source video — not the video itself. You choose modules, draw geometry (lines/areas), then run processing so reports have data. One source can have several scans (different setups on the same footage). Open scans from the global Scans list or from a source.
- Open Scans in the sidebar (or open your source and select the Scans tab).
- Create a new scan linked to your source (from the source Scans tab).
- Open the scan configuration workspace (click the scan row).
- Review AI processing settings (defaults are enough for a first demo if vehicle detection and tracker are available). Use Add only if you need optional slots.
- Draw the required Active area so it covers the roadway (or scene) you care about.
- Open Draw settings, add at least one Counting line across the path vehicles should cross. Reports primarily show counts from line crossings — without a counting line, a completed scan leaves report widgets empty.
- Save the configuration.
- Use the video player and timeline to confirm the frame and time range look correct.
- Set scan status to PENDING, then start processing (config page or list Run / Run selected).
Verify: Scan status moves through QUEUED / PROCESSING to COMPLETED. If status is FAILED, open the error hint on the list or see Scan failed and video preview.
Step 4 — View and build a report
Reports display widgets (tables, charts, filters, totals) backed by scan data.
- Open Reports in the sidebar.
- Create a new report or open an existing one.
- Open report details (row Edit action) to set metadata (name and description).
- Open the report view (click the report row).
- Leave mode on Single scan, select your scan, set the time range if needed.
- Select Apply to load widget data.
- To change layout: enter edit mode, add widgets by type (table, chart, filters, total, and others), then Save the layout.
Verify: After Apply, data widgets show values for your completed scan and selected time range.
What you built
flowchart LR
  LOC[Location] --> SRC[Source]
  SRC --> SCAN[Scan]
SCAN --> RPT[Report]| Entity | Role in this guide |
|---|---|
| Location | Where the source is deployed |
| Source | Video input and media |
| Scan | How the source video is analyzed (configure → run → results for reports) |
| Report | Visualization and export of results |
Next steps
- Configure scan geometry in depth
- Edit report layout and widgets
- Class groups — map detector classes to report labels (admins)
- Glossary
Troubleshooting
| Problem | What to do |
|---|---|
| Missing sidebar items | Check User roles and access |
| Upload fails | Confirm disk space and file format; retry from Files tab |
| Scan stays FAILED | See Scan failed and video preview |
| Report shows no data | Confirm scan COMPLETED, time range includes processed data, then Apply. For a first demo, confirm the scan has at least one Counting line and an Active area, then re-run if you added geometry after the last run |
| Yellow bar: real-time disconnected | See Real-time connection disconnected |