Maintenance
Tab: System → Maintenance.
Requires: System admin (Maintenance permission).
Operational dashboards for host resources, storage, database health, active sessions, log downloads, and service restarts.
Restart services
| Control | Effect |
|---|---|
| Restart engine | Restarts the GPU/engine process. Confirm in the dialog; wait for the overlay until the command and events channels are ready again (timeout on the order of several minutes). |
| Restart Web service | Restarts the API/web process. Confirm; wait until the API responds again (shorter timeout). The UI reconnects realtime after the bounce. |
Tip
After uploading a custom module or changing settings that require an engine reload, use Restart engine.
Engine restart may be disabled while the command channel is already down. During a planned bounce, temporary ERROR / STOPPED states are expected until the service is healthy again.
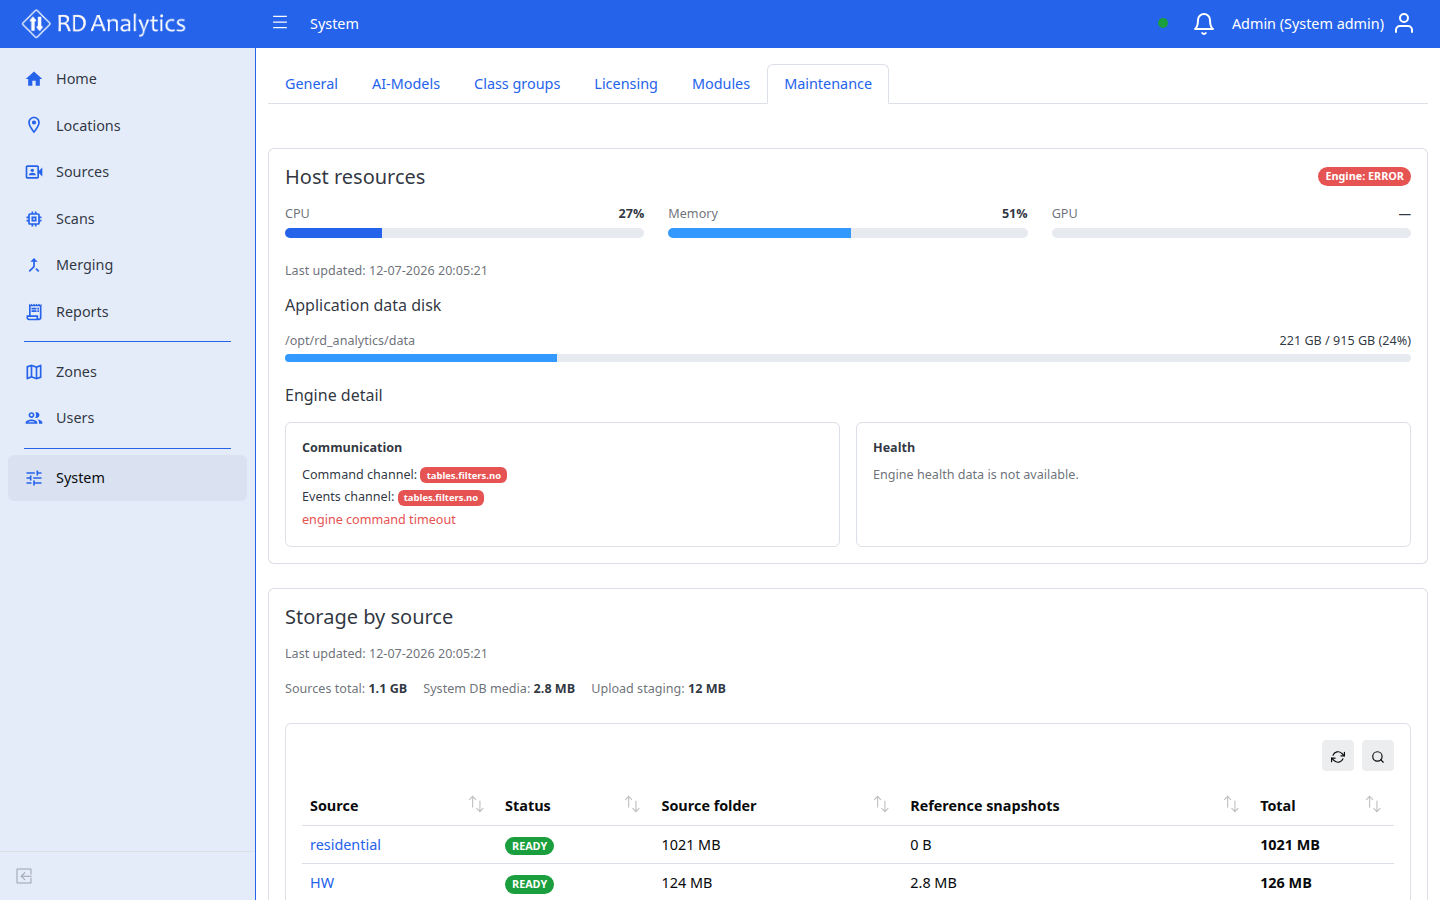
Host resources
| Element | Description |
|---|---|
| Host resources | Card title |
| Engine status badge | Current engine state (for example RUNNING, STOPPED) |
| Application data disk | Disk usage for application data |
| Engine detail | Active/queued pipelines, max pipelines, communication channels |
| Health | Engine health metrics when available |
Data refreshes on an interval while the tab is open. If a refresh fails, the card shows the last successful snapshot with a warning.
Storage by source
Summary tiles for total sources, system DB media size, and upload staging usage, plus per-source breakdown when data is available.
Database status
MongoDB health: uptime, connections, data/index/total sizes, and collection statistics.
Active sessions
Lists users currently connected to the realtime channel. Shows an empty state when nobody is connected.
Logs
Download rotated service logs as a zip archive.
| Field | Description |
|---|---|
| Service | All services, API only, or Engine only |
| Hours to include | 1–168 hours |
| Download logs | Starts archive download |
Possible errors: no files in the time window, archive too large (shorten the window), or rate limiting.