Navigation and layout
The RD Analytics interface has a left sidebar for main features, a top header for notifications and account actions, and breadcrumbs on detail pages.
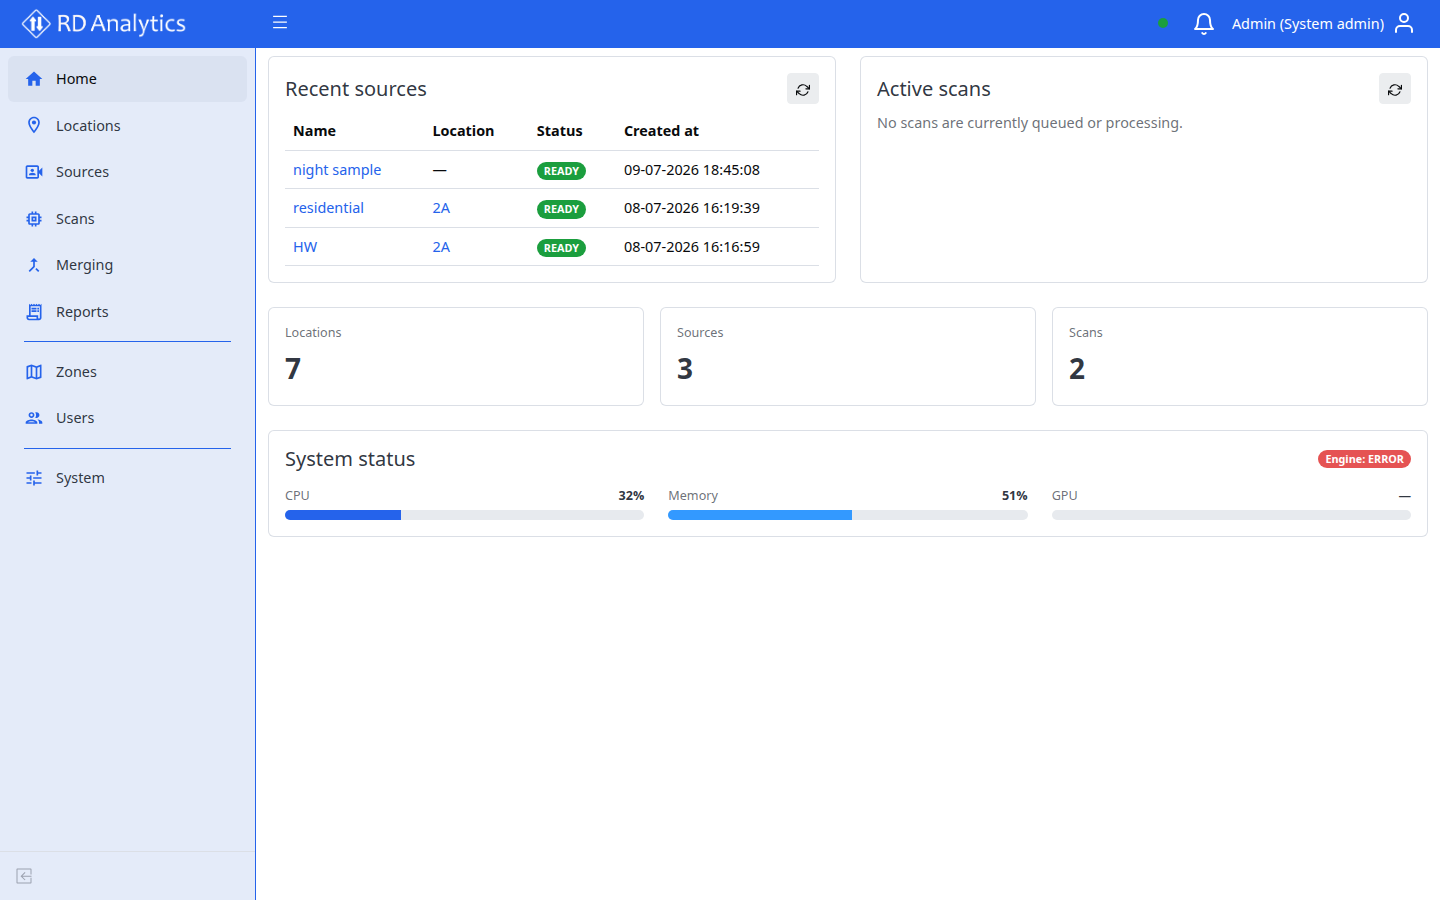
Sidebar
Items appear in workflow order. Your role may hide some entries — see User roles and access.
| Order | Label | Route |
|---|---|---|
| 1 | Home | / |
| 2 | Locations | /locations |
| 3 | Sources | /sources |
| 4 | Scans | /scans |
| 5 | Merging | /merging |
| 6 | Reports | /reports |
| — | divider | |
| 7 | Zones | /zones |
| 8 | Users | /users |
| — | divider | |
| 9 | System | /system |
The Locations map (/locations/map) is opened from the Map button on the Locations list — it is not a separate sidebar item.
Removed routes
Tasks, standalone Maintenance, and Misc were removed from the sidebar. Maintenance dashboards live under System → Maintenance tab. Legacy URLs /tasks, /maintenance, and /misc return a 404 page.
Header
| Element | Purpose |
|---|---|
| Connection indicator | Real-time channel status (colored dot) |
| Notifications (bell) | Unconfirmed notifications; badge when new items exist |
| Account menu | Profile, Notification settings, Logout |
The account menu shows your first name and authority label (for example Admin (System admin)).
Detail pages
When you open a location, source, scan, or report, you typically see:
- Back — return to the list or parent page
- Breadcrumbs — current path in the app
- Save — on forms when you have unsaved changes
List pages (tables)
Most lists share the same toolbar:
| Control | Label | Action |
|---|---|---|
| Add | Add new | Create item (or choose type for Sources) |
| Search | Search | Filter rows |
| Reload | Reload | Refresh table data |
| Selection | Delete selected | Bulk delete with confirmation |
Click a row to open details (except when clicking action icons or links in cells).
Real-time connection
If the server connection drops, a yellow bar may appear below the header. See Real-time connection disconnected.