Reports overview
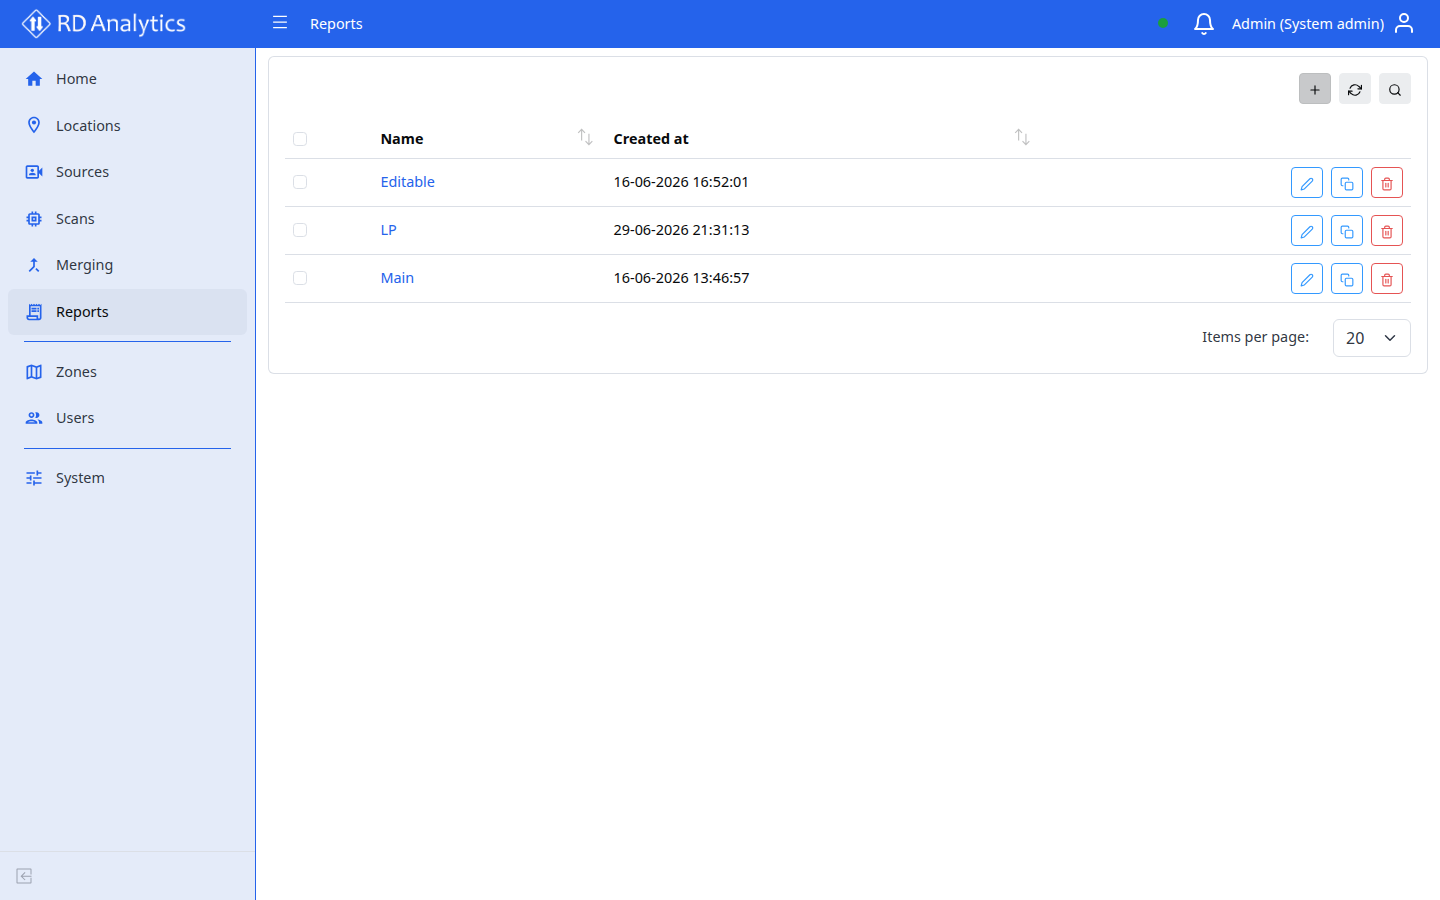
Reports are interactive dashboards built from widgets (tables, charts, filters, images). Data comes from Scan results for a selected time range.
Who uses this
- Engineers and admins create and edit reports.
- Report consumers use View mode with Apply to refresh data.
Before you begin
- At least one scan with COMPLETED status.
- Optional: Class groups configured for grouped class labels.
Key concepts
| Term | Meaning |
|---|---|
| View | /reports/{id}/view — widgets, filters, Apply |
| Details | /reports/{id}/details — name and description metadata |
| Widget | One visual or control on the grid |
| Apply | Refresh data widgets with current filters and time range |
| Edit layout | Drag, resize, add/remove widgets; Save persists layout |